Unlock a world of possibilities! Login now and discover the exclusive benefits awaiting you.

- Qlik Community
- :
- Forums
- :
- Analytics & AI
- :
- Products & Topics
- :
- Visualization and Usability
- :
- How to create a HC curve line?
Options
- Subscribe to RSS Feed
- Mark Topic as New
- Mark Topic as Read
- Float this Topic for Current User
- Bookmark
- Subscribe
- Mute
- Printer Friendly Page
Turn on suggestions
Auto-suggest helps you quickly narrow down your search results by suggesting possible matches as you type.
Showing results for

 guilherme_hn
Partner - Contributor II
2019-02-01
12:06 PM
- Mark as New
- Bookmark
- Subscribe
- Mute
- Subscribe to RSS Feed
- Permalink
- Report Inappropriate Content
How to create a HC curve line?
Hello Qommunity !
I've tried to do a chart to show to growth of my company and I'm not able to do all I want.
Here it is.
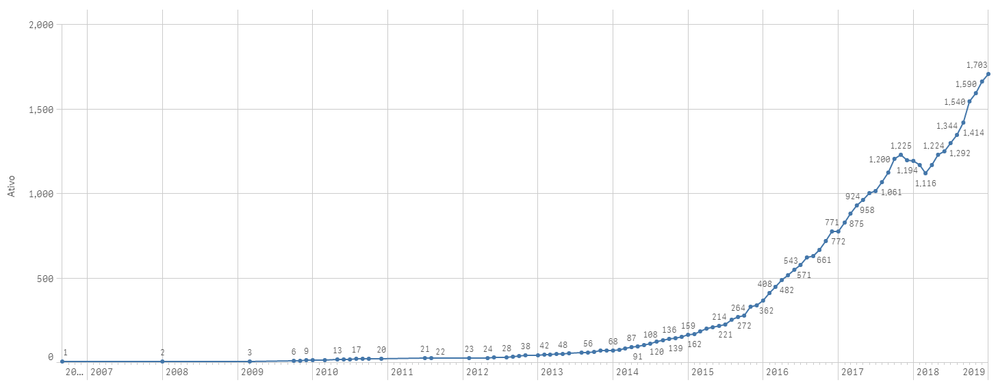
The problem is when i filter some year. I want to show the number of employee that started the year and ended year.
2018 started with 1190 and ended with 1703 employees, but in the chart show like this:
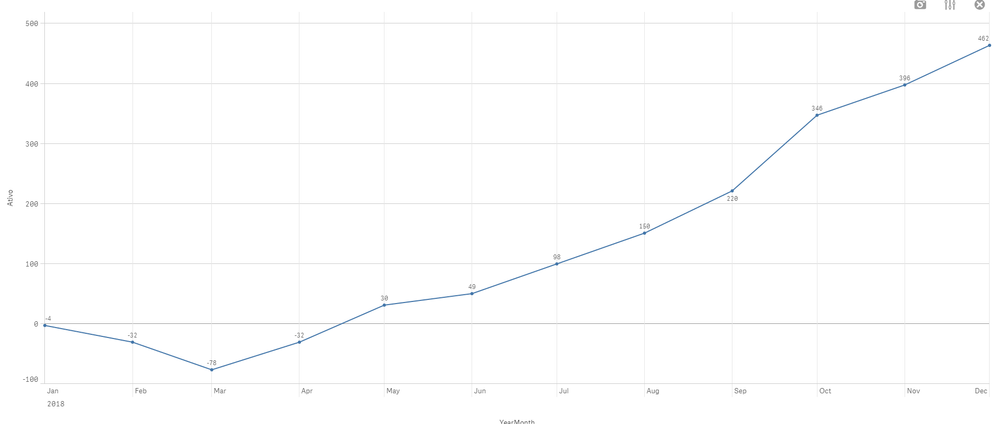
How can I fix that?
Here is the set statement that I'm using:
RangeSum(Above(count(distinct[ASSOCIATE ID-ID]), 0, RowNo()))-
RangeSum(Above(count(distinct [Id Global Desligado]), 0, RowNo()))
Appreciate!
1,432 Views
2 Replies

 Channa
Specialist III
2019-02-04
03:35 AM
- Mark as New
- Bookmark
- Subscribe
- Mute
- Subscribe to RSS Feed
- Permalink
- Report Inappropriate Content
=sum ( {<Year = >} TotalSuggestions)
try to exclude year selection use expression like this
Channa
1,404 Views
Channa
Specialist III
2019-02-04
03:38 AM
- Mark as New
- Bookmark
- Subscribe
- Mute
- Subscribe to RSS Feed
- Permalink
- Report Inappropriate Content
may be you have master drill item , if you select year it is showing month, avoid drill
Channa
1,399 Views
