Unlock a world of possibilities! Login now and discover the exclusive benefits awaiting you.

Announcements
Talend Cloud AWS EU Scheduled Outage: Starting Tues 26 May 21:00 CEST with expected completion Wed 27 May 01:00 CEST
- Qlik Community
- :
- Forums
- :
- Analytics & AI
- :
- Products & Topics
- :
- Visualization and Usability
- :
- How to create area chart in Qlik sense?
Options
- Subscribe to RSS Feed
- Mark Topic as New
- Mark Topic as Read
- Float this Topic for Current User
- Bookmark
- Subscribe
- Mute
- Printer Friendly Page
Turn on suggestions
Auto-suggest helps you quickly narrow down your search results by suggesting possible matches as you type.
Showing results for

Anonymous
Not applicable
2017-06-08
02:16 PM
- Mark as New
- Bookmark
- Subscribe
- Mute
- Subscribe to RSS Feed
- Permalink
- Report Inappropriate Content
How to create area chart in Qlik sense?
How to create an area chart in Qlik sense as the attachment?
Thanks!

4,023 Views
1 Reply
Anonymous
Not applicable
2017-06-08
03:24 PM
Author
- Mark as New
- Bookmark
- Subscribe
- Mute
- Subscribe to RSS Feed
- Permalink
- Report Inappropriate Content
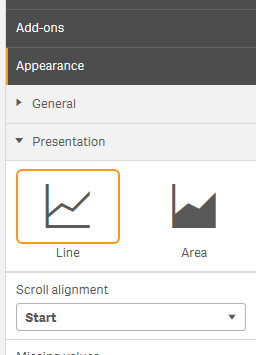
Under the presentation tab in line chart you can switch to Area. I'm not sure how you can make the bottom invisible but you may be able to use a colour expression to make the bottom part white.
3,613 Views