Unlock a world of possibilities! Login now and discover the exclusive benefits awaiting you.
- Qlik Community
- :
- Forums
- :
- Analytics & AI
- :
- Products & Topics
- :
- Visualization and Usability
- :
- How to find change in the price across ratio?
Options
- Subscribe to RSS Feed
- Mark Topic as New
- Mark Topic as Read
- Float this Topic for Current User
- Bookmark
- Subscribe
- Mute
- Printer Friendly Page
Turn on suggestions
Auto-suggest helps you quickly narrow down your search results by suggesting possible matches as you type.
Showing results for
Creator
2018-10-29
01:43 AM
- Mark as New
- Bookmark
- Subscribe
- Mute
- Subscribe to RSS Feed
- Permalink
- Report Inappropriate Content
How to find change in the price across ratio?
Dear All,
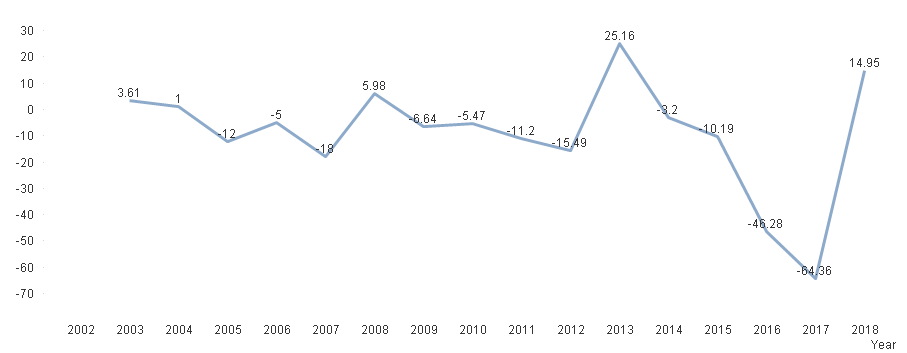
I want to find the Change in the Price(Delta Price) Across the ratio in qliksense.
I want to show in line chart as Ratio on X-axis & Change in the Price(Delta Price) on Y-axis.
Below is my data.
Please Help.
| Year | Ratio | Price |
| 2002 | 1.29 | 25.61 |
| 2003 | 1.32 | 22 |
| 2004 | 1.50 | 21 |
| 2005 | 1.39 | 33 |
| 2006 | 1.28 | 38 |
| 2007 | 1.42 | 56 |
| 2008 | 1.38 | 50.02 |
| 2009 | 1.35 | 56.66 |
| 2010 | 1.31 | 62.13 |
| 2011 | 1.18 | 73.33 |
| 2012 | 1.30 | 88.82 |
| 2013 | 1.23 | 63.66 |
| 2014 | 1.02 | 66.86 |
| 2015 | 0.75 | 77.05 |
| 2016 | 0.59 | 123.33 |
| 2017 | 0.63 | 187.69 |
| 2018 | 0.38 | 172.74 |
Regards,
Priyal.
1,389 Views
6 Replies
2018-10-29
01:59 AM
- Mark as New
- Bookmark
- Subscribe
- Mute
- Subscribe to RSS Feed
- Permalink
- Report Inappropriate Content
Any example you have?
Best Anil, When applicable please mark the correct/appropriate replies as "solution" (you can mark up to 3 "solutions". Please LIKE threads if the provided solution is helpful
1,318 Views
Creator
2018-10-29
02:26 AM
Author
- Mark as New
- Bookmark
- Subscribe
- Mute
- Subscribe to RSS Feed
- Permalink
- Report Inappropriate Content
Hi Anil,
Thanks for your reply.
Example is below.
For year 2002,Rate 25.61 & year 2003,Rate 22
So change in price for year 2003 will be 25.31-22 i.e. 3.61
Regards,
Priyal.
1,318 Views
2018-10-29
10:05 PM
- Mark as New
- Bookmark
- Subscribe
- Mute
- Subscribe to RSS Feed
- Permalink
- Report Inappropriate Content
Check if that helps?
Above(Sum(Price))-Sum(Price)
Best Anil, When applicable please mark the correct/appropriate replies as "solution" (you can mark up to 3 "solutions". Please LIKE threads if the provided solution is helpful
Creator
2018-10-30
07:26 AM
Author
- Mark as New
- Bookmark
- Subscribe
- Mute
- Subscribe to RSS Feed
- Permalink
- Report Inappropriate Content
Thanks a lot...
1,318 Views
2018-10-30
08:43 AM
- Mark as New
- Bookmark
- Subscribe
- Mute
- Subscribe to RSS Feed
- Permalink
- Report Inappropriate Content
Glad we were able to find, Can you please close this thread by flag "Correct answer"
Best Anil, When applicable please mark the correct/appropriate replies as "solution" (you can mark up to 3 "solutions". Please LIKE threads if the provided solution is helpful
1,318 Views
Creator
2018-10-30
11:45 AM
- Mark as New
- Bookmark
- Subscribe
- Mute
- Subscribe to RSS Feed
- Permalink
- Report Inappropriate Content
yep please close this discussion by mentionning loveisfail answer as correct
1,318 Views