Unlock a world of possibilities! Login now and discover the exclusive benefits awaiting you.

- Qlik Community
- :
- Forums
- :
- Analytics & AI
- :
- Products & Topics
- :
- Visualization and Usability
- :
- How to get chart with measure by two dates from on...
Options
- Subscribe to RSS Feed
- Mark Topic as New
- Mark Topic as Read
- Float this Topic for Current User
- Bookmark
- Subscribe
- Mute
- Printer Friendly Page
Turn on suggestions
Auto-suggest helps you quickly narrow down your search results by suggesting possible matches as you type.
Showing results for

Anonymous
Not applicable
2018-03-14
09:45 AM
- Mark as New
- Bookmark
- Subscribe
- Mute
- Subscribe to RSS Feed
- Permalink
- Report Inappropriate Content
How to get chart with measure by two dates from one table
Hello,
I have one table where is ticket id, receive_date, resolve_date. Now i want to make chart with
X axis - period date from master calendar.
Y axis - 1 line count of receive tickets
2 line count of resolve tickets
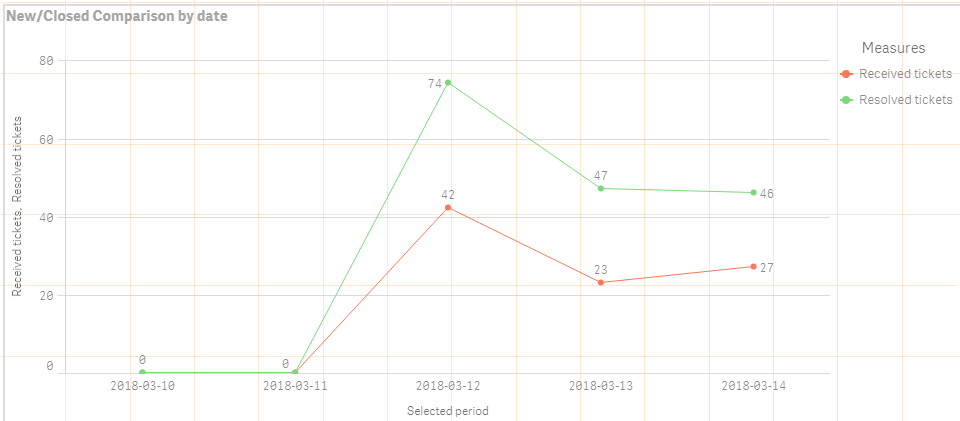
How i can achieve it?
- Tags:
- master calender
1,503 Views
2 Replies

 sunny_talwar
MVP
2018-03-14
01:03 PM
- Mark as New
- Bookmark
- Subscribe
- Mute
- Subscribe to RSS Feed
- Permalink
- Report Inappropriate Content
Look into creating a Canonical Date

 zebhashmi
Specialist
2018-03-14
02:08 PM
- Mark as New
- Bookmark
- Subscribe
- Mute
- Subscribe to RSS Feed
- Permalink
- Report Inappropriate Content
i don't think it will help but maybe you can find some way from it
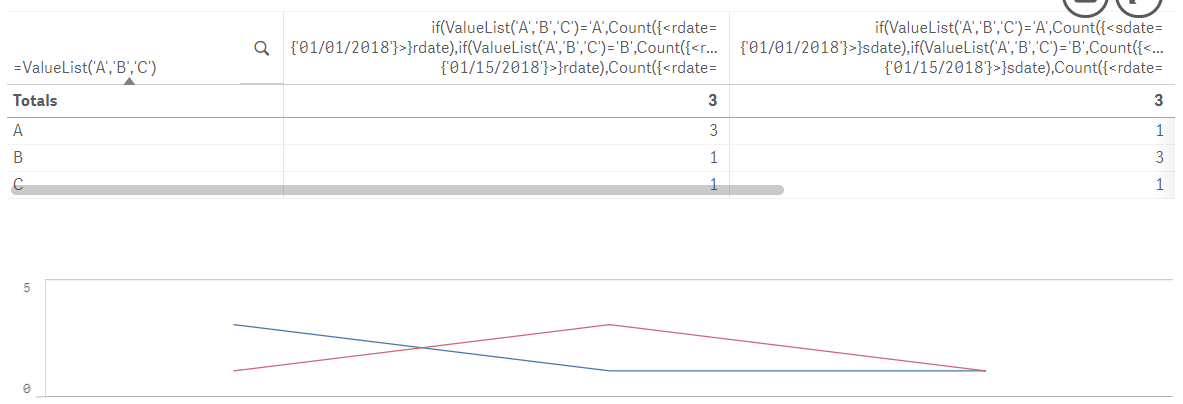
if(ValueList('A','B','C')='A',Count({<rdate={'01/01/2018'}>}rdate),if(ValueList('A','B','C')='B',Count({<rdate={'01/15/2018'}>}rdate),Count({<rdate={'01/30/2018'}>}rdate)))
1,426 Views