Unlock a world of possibilities! Login now and discover the exclusive benefits awaiting you.
- Qlik Community
- :
- Forums
- :
- Analytics & AI
- :
- Products & Topics
- :
- Visualization and Usability
- :
- How to pick out a number from filterpane and conne...
- Subscribe to RSS Feed
- Mark Topic as New
- Mark Topic as Read
- Float this Topic for Current User
- Bookmark
- Subscribe
- Mute
- Printer Friendly Page
- Mark as New
- Bookmark
- Subscribe
- Mute
- Subscribe to RSS Feed
- Permalink
- Report Inappropriate Content
How to pick out a number from filterpane and connect it to a function for charts? getfieldselection() or getselectedcount()
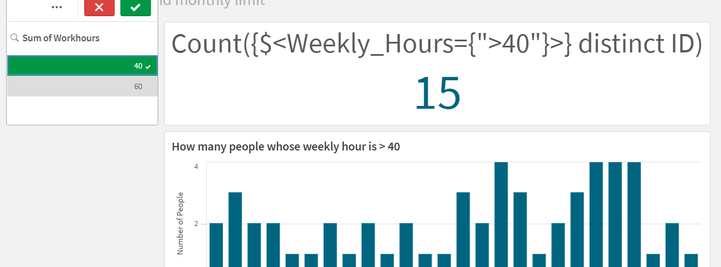
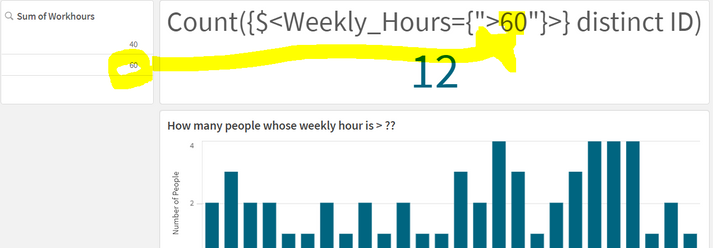
I created two graphs with,
Count({$<Weekly_Hours={">60"}>} distinct ID)
Count({$<Weekly_Hours={">40"}>} distinct ID)
But want display above in one graph by linking filterpane number and getfieldselection() or getselectedcount()
I tried
Count({$<Weekly_Hours> ={">"}+ getselectedcount(WeeklyHourSum)>} distinct ID)
Count({$<Weekly_Hours= '>' & getselectedcount(WeeklyHourSum)>} distinct ID)
Count({$<Weekly_Hours={">"} + GetFieldSelections(WeeklyHourSum)>} distinct [Personnel Number])
Count({$<Weekly_Hours={ ">" & getselectedcount(WeeklyHourSum)}>} distinct [Personnel Number])
None of them work... 😞
Accepted Solutions
- Mark as New
- Bookmark
- Subscribe
- Mute
- Subscribe to RSS Feed
- Permalink
- Report Inappropriate Content
Hi @nezuko_kamado ,
Please try below expression.
=Count({<Weekly_Hours={"$(='>='&GetFieldSelections(Weekly_Hours))"}>} distinct ID)
Abhijit
keep Qliking...
Help users find answers! Don't forget to mark a solution that worked for you!

