Unlock a world of possibilities! Login now and discover the exclusive benefits awaiting you.
- Qlik Community
- :
- Forums
- :
- Analytics & AI
- :
- Products & Topics
- :
- Visualization and Usability
- :
- How to use fields from another table as dimension?
- Subscribe to RSS Feed
- Mark Topic as New
- Mark Topic as Read
- Float this Topic for Current User
- Bookmark
- Subscribe
- Mute
- Printer Friendly Page
- Mark as New
- Bookmark
- Subscribe
- Mute
- Subscribe to RSS Feed
- Permalink
- Report Inappropriate Content
How to use fields from another table as dimension?
Hi all,
I'm new to Qlik sense and I'm struggling with some concepts.
The following screenshot contains part of my data model:
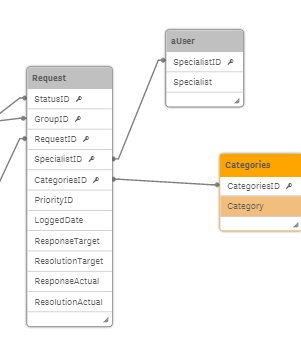
As you can see Request is linked to Categories via CategoriesID
Now I am trying to create a graph displaying the total amount of requests (tickets) per category . For obvious reasons I don't want to use the CategoriesID but the Category field instead.
So far I have the following:
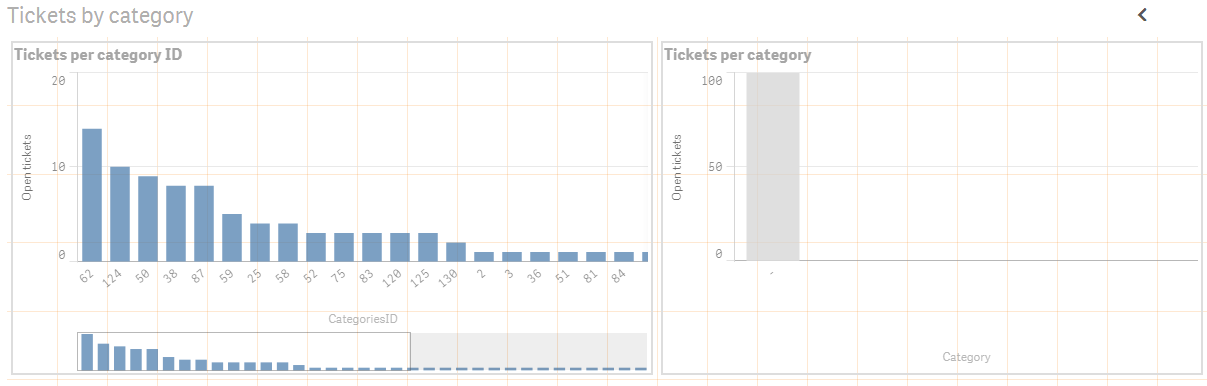
On the left hand side I use CategoriesID as dimension, on the right hand side I use Category as dimension. Both graphs use the same measure.
I would expect that both graphs display the same (except from the labels), however the graph using Category doesn't work at all.
Can someone explain what I'm doing wrong here?
Thanks in advance!
- « Previous Replies
-
- 1
- 2
- Next Replies »
- Mark as New
- Bookmark
- Subscribe
- Mute
- Subscribe to RSS Feed
- Permalink
- Report Inappropriate Content
Thank you very much!
With that expression the graph renders correctly and the displayed data is correct.
Now I'm wondering why my first expression worked for CategoryID but didn't for Category. Anyway, I'll have to study expressions.
- Mark as New
- Bookmark
- Subscribe
- Mute
- Subscribe to RSS Feed
- Permalink
- Report Inappropriate Content
Your set analysis expression incorrect, may be that is the reason.
If you got the answer please close this thread by giving correct answer to the post which helps you in getting the answer.
Regards,
jagan.
- « Previous Replies
-
- 1
- 2
- Next Replies »