Unlock a world of possibilities! Login now and discover the exclusive benefits awaiting you.

- Qlik Community
- :
- Forums
- :
- Analytics & AI
- :
- Products & Topics
- :
- Visualization and Usability
- :
- Integrate Fields
- Subscribe to RSS Feed
- Mark Topic as New
- Mark Topic as Read
- Float this Topic for Current User
- Bookmark
- Subscribe
- Mute
- Printer Friendly Page

 mateo_florence
- Mark as New
- Bookmark
- Subscribe
- Mute
- Subscribe to RSS Feed
- Permalink
- Report Inappropriate Content
Integrate Fields
Hello,
I have a problem and to explain it I will give an example of a case.
I have loaded a Operation Table of purchase with the following fields:
| Bank | Id Operation | Operation amount | Type of Commission 1 | Commission amount 1 | Type of Commission 2 | Commission amount 2 |
|---|---|---|---|---|---|---|
| A | 000001 | 99,99 € | Commission A | 0,50 € | Commission B | 1,50 € |
| B | 000002 | 49,99 € | Commission A | 0,25 € | Commission C | 1,20 € |
Each Operation can have a maximum of 2 different commissions.
I can not modify the table and I need to create the "Type of Commission" field that contains the values of the "Type of Commission 1" and "Type of Commission 2 fields". Example of what I need:
| Bank | Id Operation | Type of Commission | Commission amount |
|---|---|---|---|
| A | 000001 | Commission A | 0,50 € |
| B | 000002 | Commission A | 0,25 € |
| A | 000001 | Commission B | 1,50 € |
| B | 000002 | Commission C | 1,20 € |
Which is the best solution?
PS: I do not have access to the load script
Thanks!!
 felipedl
- Mark as New
- Bookmark
- Subscribe
- Mute
- Subscribe to RSS Feed
- Permalink
- Report Inappropriate Content
Hi Mateo,
I've created a script for your need, that gets each row and transforms it into two rows in a new table, containing the two possible types os comission and values.
I copied your example to a spreadsheet so i could load it into Qlik
Here's the script:
Data:
LOAD Bank,
     [Id Operation],
     [Operation amount],
     [Type of Commission 1],
     [Commission amount 1],
     [Type of Commission 2],
     [Commission amount 2]
FROM

(ooxml, embedded labels, table is Plan1);


for each BankID in FieldValueList('Bank')
NoConcatenate
_tmpTable:
Load
Bank as _tmpBank,
[Id Operation],
[Type of Commission 1],
      [Commission amount 1],
      [Type of Commission 2],
      [Commission amount 2]
    Resident Data
    where Bank='$(BankID)';

    for i = 0 to NoOfRows('_tmpTable')
    let j = $(i)+1;
    let _tmpIdOperation = peek('Id Operation',0,'_tmpTable');
    let _tmpTypeComission = peek('Type of Commission $(j)',0,'_tmpTable');
    let _tmpTypeAmount = peek('Commission amount $(j)',0,'_tmpTable');

    [Comission Amount]:
    Load
    '$(BankID)' as Bank,
    '$(_tmpIdOperation)' as [Id Operation New],
    '$(_tmpTypeComission)' as [Type of Comission New],
    '$(_tmpTypeAmount)' as [Commission Amount]
    AutoGenerate(1);
    next;

drop table _tmpTable;

next;
As a result, I get
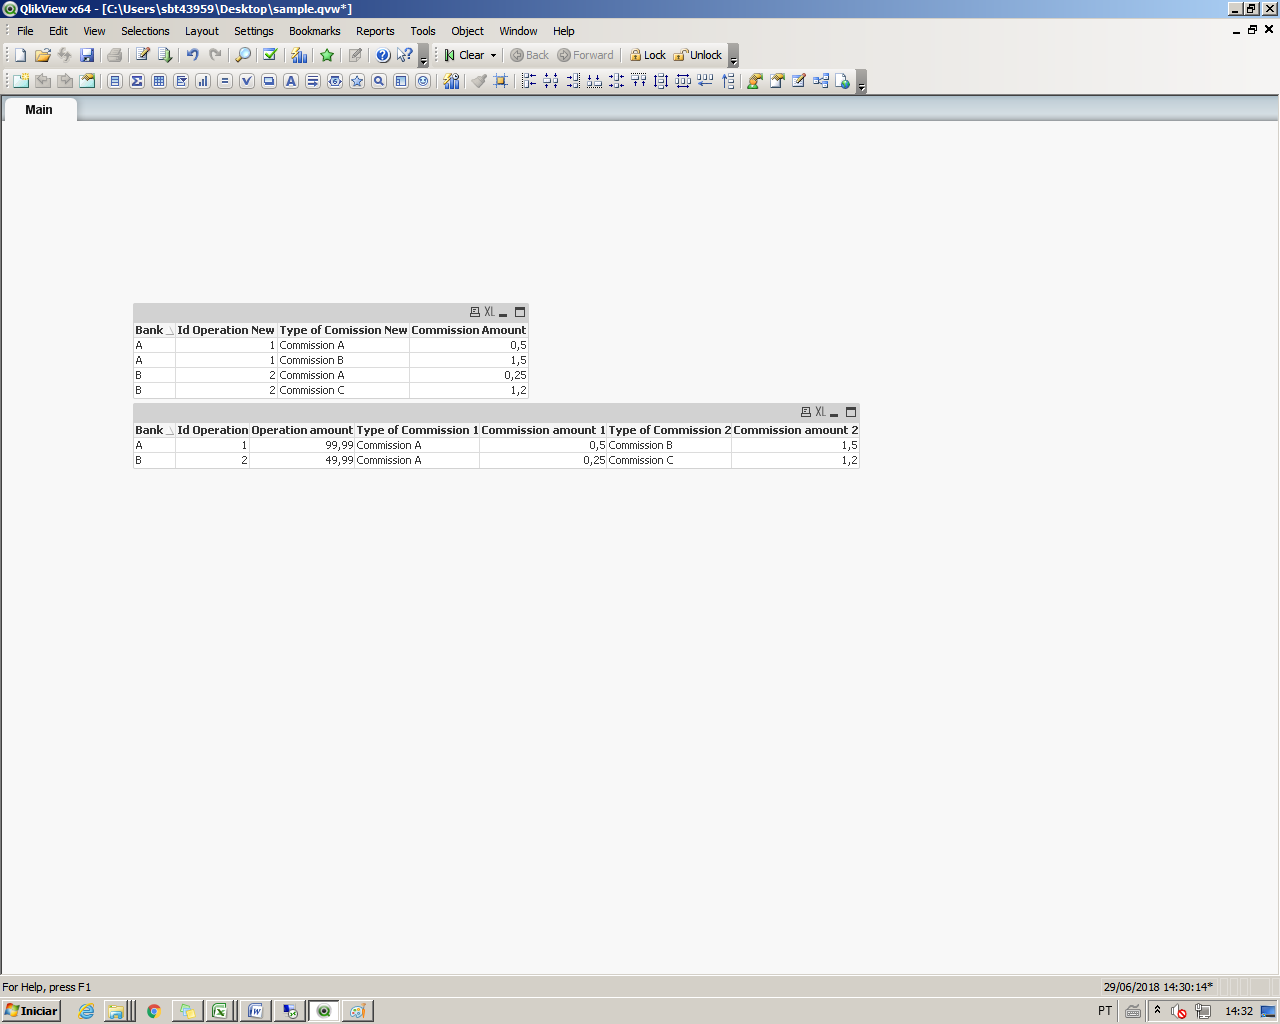
Attached the QVW i used.
PS: Just know I saw you cant access the script, but as to my opinion, it would be quite difficult and rather not possible to do it in a graph without data transformation.

 maxgro
- Mark as New
- Bookmark
- Subscribe
- Mute
- Subscribe to RSS Feed
- Permalink
- Report Inappropriate Content
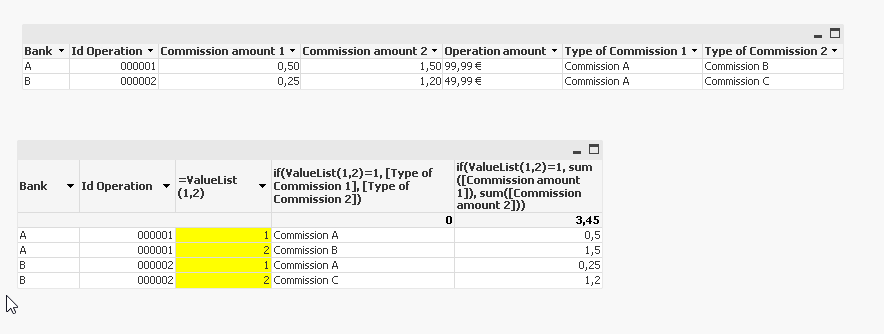
maybe with ValueList, look at he attachment
you can hide the yellow column in presentation tab
 rubenmarin
- Mark as New
- Bookmark
- Subscribe
- Mute
- Subscribe to RSS Feed
- Permalink
- Report Inappropriate Content
Hi Mateo, using a bucle can be another option:
FOR i=1 to 2 // Number of comissions
Data:
LOAD Bank,
[Id Operation],
[Operation amount],
[Type of Commission $(i)] as [Type of Comission],
[Commission amount $(i)] as [Comission Amount]
FROM FileToLoad;
NEXT
