Unlock a world of possibilities! Login now and discover the exclusive benefits awaiting you.

- Qlik Community
- :
- Forums
- :
- Analytics & AI
- :
- Products & Topics
- :
- Visualization and Usability
- :
- Issue with creating a map visualization.
- Subscribe to RSS Feed
- Mark Topic as New
- Mark Topic as Read
- Float this Topic for Current User
- Bookmark
- Subscribe
- Mute
- Printer Friendly Page

 Neymar_Jr
- Mark as New
- Bookmark
- Subscribe
- Mute
- Subscribe to RSS Feed
- Permalink
- Report Inappropriate Content
Issue with creating a map visualization.
I want to create a map visualization which uses the dimension as Region and measure as Sales. Now, i want the map to show only the sites which has negative ebitda. How do i do that?
Thank you!
- « Previous Replies
-
- 1
- 2
- Next Replies »

 lironbaram
- Mark as New
- Bookmark
- Subscribe
- Mute
- Subscribe to RSS Feed
- Permalink
- Report Inappropriate Content
hi
try something like
Dimension : Region
Expression : if(Ebidata<0 , Sale) , this should only show you the relevant regions

 arulsettu
- Mark as New
- Bookmark
- Subscribe
- Mute
- Subscribe to RSS Feed
- Permalink
- Report Inappropriate Content
can you share sample app

 agigliotti
- Mark as New
- Bookmark
- Subscribe
- Mute
- Subscribe to RSS Feed
- Permalink
- Report Inappropriate Content
maybe this:
Dim = Region
Measure = Sum( if( ebitda < 0, Sales, 0 ) )
and finally disable show 0 values option.
Follow me on my LinkedIn | Know Gamma Informatica at gammainformatica.it
Neymar_Jr
- Mark as New
- Bookmark
- Subscribe
- Mute
- Subscribe to RSS Feed
- Permalink
- Report Inappropriate Content
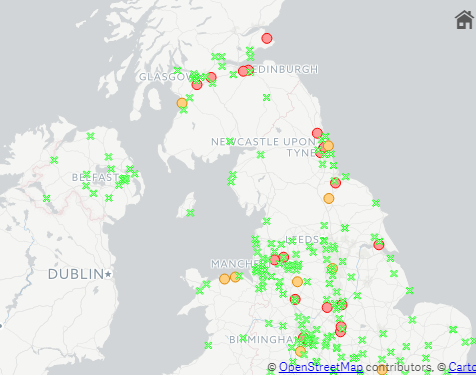 Hi Liron, i used your expression.This is what it shows now.I only want the bubbles not the crosses. Can you help me with that?
Thank you!
 shraddha_g
- Mark as New
- Bookmark
- Subscribe
- Mute
- Subscribe to RSS Feed
- Permalink
- Report Inappropriate Content
Are you using any extension?
Neymar_Jr
- Mark as New
- Bookmark
- Subscribe
- Mute
- Subscribe to RSS Feed
- Permalink
- Report Inappropriate Content
Yes, i am using variable extension and that is used to change the value of sales and ebitda.
shraddha_g
- Mark as New
- Bookmark
- Subscribe
- Mute
- Subscribe to RSS Feed
- Permalink
- Report Inappropriate Content
No I am asking about Map
Neymar_Jr
- Mark as New
- Bookmark
- Subscribe
- Mute
- Subscribe to RSS Feed
- Permalink
- Report Inappropriate Content
No, for map i am using the default map.
Neymar_Jr
- Mark as New
- Bookmark
- Subscribe
- Mute
- Subscribe to RSS Feed
- Permalink
- Report Inappropriate Content
Done!
I used the following expression as measure:
if(ebitda<0,Sum(Sales),0)
and then i unchecked Include zero values.

- « Previous Replies
-
- 1
- 2
- Next Replies »