Unlock a world of possibilities! Login now and discover the exclusive benefits awaiting you.
Announcements
Save $650 on Qlik Connect, Dec 1 - 7, our lowest price of the year. Register with code CYBERWEEK: Register
- Qlik Community
- :
- Forums
- :
- Analytics & AI
- :
- Products & Topics
- :
- Visualization and Usability
- :
- Limit the number of displayed dimensions on chart
Options
- Subscribe to RSS Feed
- Mark Topic as New
- Mark Topic as Read
- Float this Topic for Current User
- Bookmark
- Subscribe
- Mute
- Printer Friendly Page
Turn on suggestions
Auto-suggest helps you quickly narrow down your search results by suggesting possible matches as you type.
Showing results for
Not applicable
2017-02-15
09:42 AM
- Mark as New
- Bookmark
- Subscribe
- Mute
- Subscribe to RSS Feed
- Permalink
- Report Inappropriate Content
Limit the number of displayed dimensions on chart
Hi,
I have a chart, that has 2 dimensions (year and Half year).
As a measurement, I have the following expression:
(RangeSum( Above(TOTAL sum([Palautus yhteensä])+SUM([Maksu ulos]), 0, NoOfRows(TOTAL))))+SUM(Valuation)
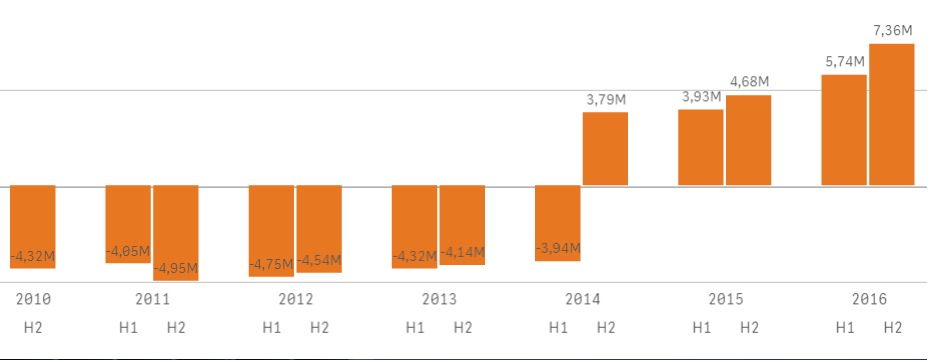
Question: How do I limit the number of dimensions displayed? For example, If I would like only to display all H1/H2 from 2011 till 2016 and leave 2010 away from the chart. But As it is a cumulative formula, the values from previous years should still be displayed in the charts periods. Is this possible to do?
Thanks for the help!
339 Views
0 Replies