Unlock a world of possibilities! Login now and discover the exclusive benefits awaiting you.

- Qlik Community
- :
- Forums
- :
- Analytics & AI
- :
- Products & Topics
- :
- Visualization and Usability
- :
- Re: MAT (Moving Annual Total ) calculation for a s...
- Subscribe to RSS Feed
- Mark Topic as New
- Mark Topic as Read
- Float this Topic for Current User
- Bookmark
- Subscribe
- Mute
- Printer Friendly Page

 danieladv
- Mark as New
- Bookmark
- Subscribe
- Mute
- Subscribe to RSS Feed
- Permalink
- Report Inappropriate Content
MAT (Moving Annual Total ) calculation for a specific month
Hi all
I have a tricky problem.
I will create a line diagram that will show the sum of unit in MAT with year-month dimension for last 3 years.
MAT should displayed by a line, where each data point is MAT calculation for a specific month. For instance, August 18 will show (MAT August 18 = sum of measure from Sept 17 to Aug 18)
I have create measures for MAT CY, MAT-1 LY and MAT-2 2 Years back
MAT: Sum({=$(=Max(MonthKey)-99)”} >} Units)
MAT1: Sum({=$(=Max(MonthKey)-199) < $(=Max(MonthKey)-99) ”} >} Units)
MAT2: Sum({=$(=Max(MonthKey)-299) < $(=Max(MonthKey)-199) ”} >} Units)
I tried this calculation I got from this forum
Dimension: MonthKey
FirstSortedValue({<MonthKey = {$(=Max({<Year = {$(=Max(Year))}>}MonthKey))}, Year = {"$(='<=' & Max(Year))"}, Month>}Aggr(RangeSum(Above(Sum({<MonthKey>}Units), 0, 36)), MonthKey),
-Aggr(Only({<MonthKey>}MonthKey), MonthKey))
But it just give me the total
I'm not aloud to change anything in the script!
This is want I want (Se red):
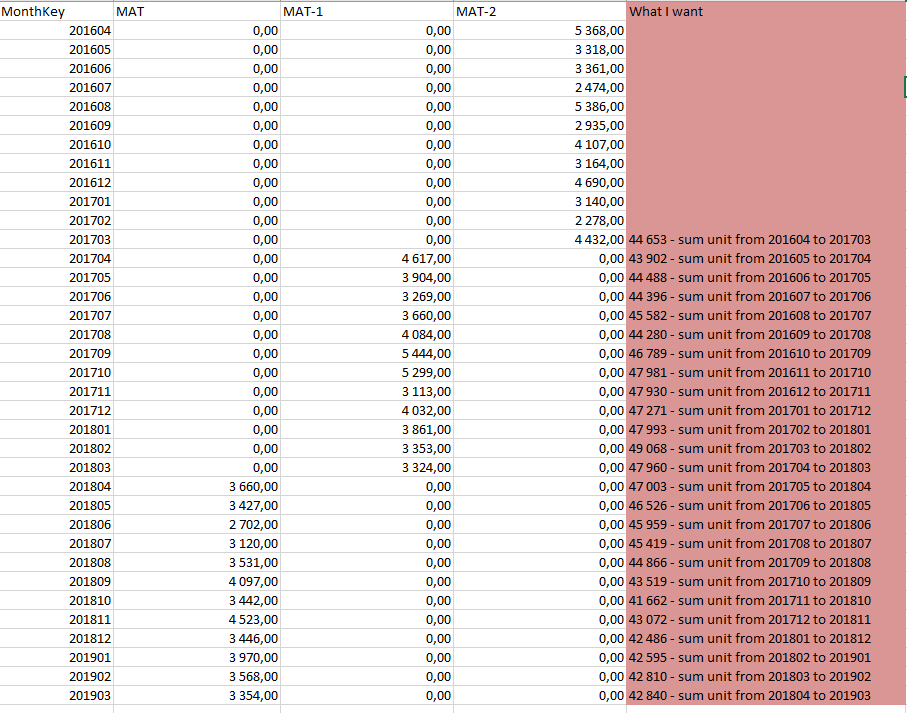
I hope someone can help me!


- Mark as New
- Bookmark
- Subscribe
- Mute
- Subscribe to RSS Feed
- Permalink
- Report Inappropriate Content
You want to one year back calc. for MAT-3? If so, May be use this?
FirstSortedValue({<MonthKey = {">=$(=AddMonths(Max({<Year = {$(=Max(Year))}>}MonthKey),-12))<=$(=Max({<Year = {$(=Max(Year))}>}MonthKey))"}, Year = {"$(='<=' & Max(Year))"}, Month>} Aggr(RangeSum(Above(Sum({<MonthKey>}Units), 0, 36)), MonthKey), -Aggr(Only({<MonthKey>}MonthKey), MonthKey))
Else, Can I get that logic behind?
danieladv
- Mark as New
- Bookmark
- Subscribe
- Mute
- Subscribe to RSS Feed
- Permalink
- Report Inappropriate Content
Hi Anil and thanks:)
I think I fix the first part:)
This is what I want to do:
The graph below contains both MAT growth % and MAT actual (calculated for each month of the year). Growth is displayed by bars. Each bar should display Growth MAT calculated for a specific month. For instance, a bar for August 18 will show (MAT August 18- MAT August 17)/ MAT August 17.
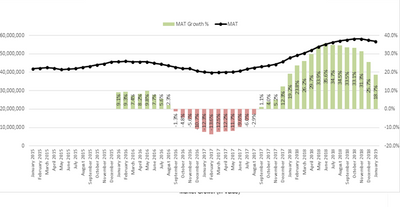
I'm done with the black line , the MAT Actual with this expression: rangesum(above(total sum(Units),0,12))
Now I would like help with MAT Growth%. As the green bars show. I already have expressions for MAT, MAT1 and MAT2 for another purpose. They look like this:
MAT:
Sum({<MonthKey = {“>=$(=Max(MonthKey) - 99)”} >} Units )
/
Round(Sum( {<MonthKey = {“>=$(=Max(MonthKey) - 199) < $(=Max(MonthKey) - 99) ”} >} Units), 0.0001) – 1
MAT1:
Sum({<MonthKey = {“>=$(=Max(MonthKey) - 199) < $(= Max(MonthKey) – 99 ”} >} Units)
/
Round(Sum( {<MonthKey = {“>=$(=Max(MonthKey) - 299) < $(=Max(MonthKey) - 199) ”} >} Units ), 0.0001) – 1
MAT2:
Sum({<MonthKey = {“>=$(=Max(MonthKey) - 199) < $(= Max(MonthKey) – 99 ”} >} Units )
/
Round(Sum( {< >} Units), 0.0001) – 1)))
MonthKey =
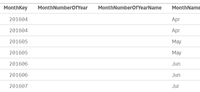
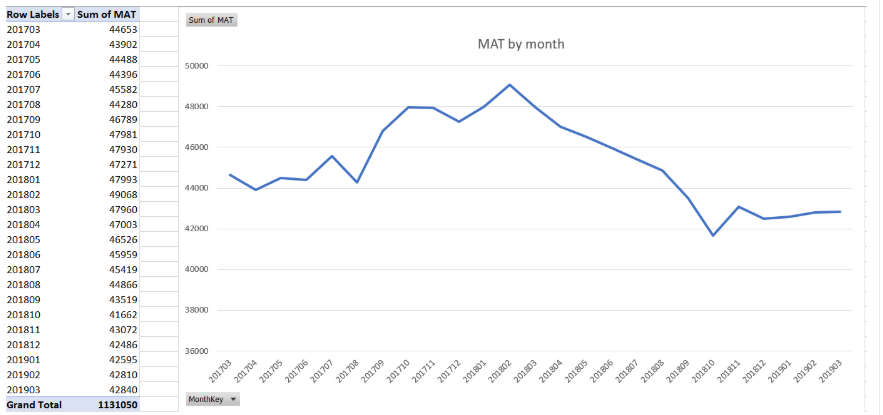
Maybe I can use the same calc. as for MAT actual, but put the Growth expression in the sum - rangesum(above(total sum(Here,0,12)) .
Hope u can help me, thanks again:)
