Unlock a world of possibilities! Login now and discover the exclusive benefits awaiting you.

- Qlik Community
- :
- Forums
- :
- Analytics & AI
- :
- Products & Topics
- :
- Visualization and Usability
- :
- Measure not working as desired
- Subscribe to RSS Feed
- Mark Topic as New
- Mark Topic as Read
- Float this Topic for Current User
- Bookmark
- Subscribe
- Mute
- Printer Friendly Page

- Mark as New
- Bookmark
- Subscribe
- Mute
- Subscribe to RSS Feed
- Permalink
- Report Inappropriate Content
Measure not working as desired
Hi all,
I wanted to plot an average monthly sum for a measure.
I used the below formula.
(AVG(
Aggr(Sum(IncidentCount),Month)
))
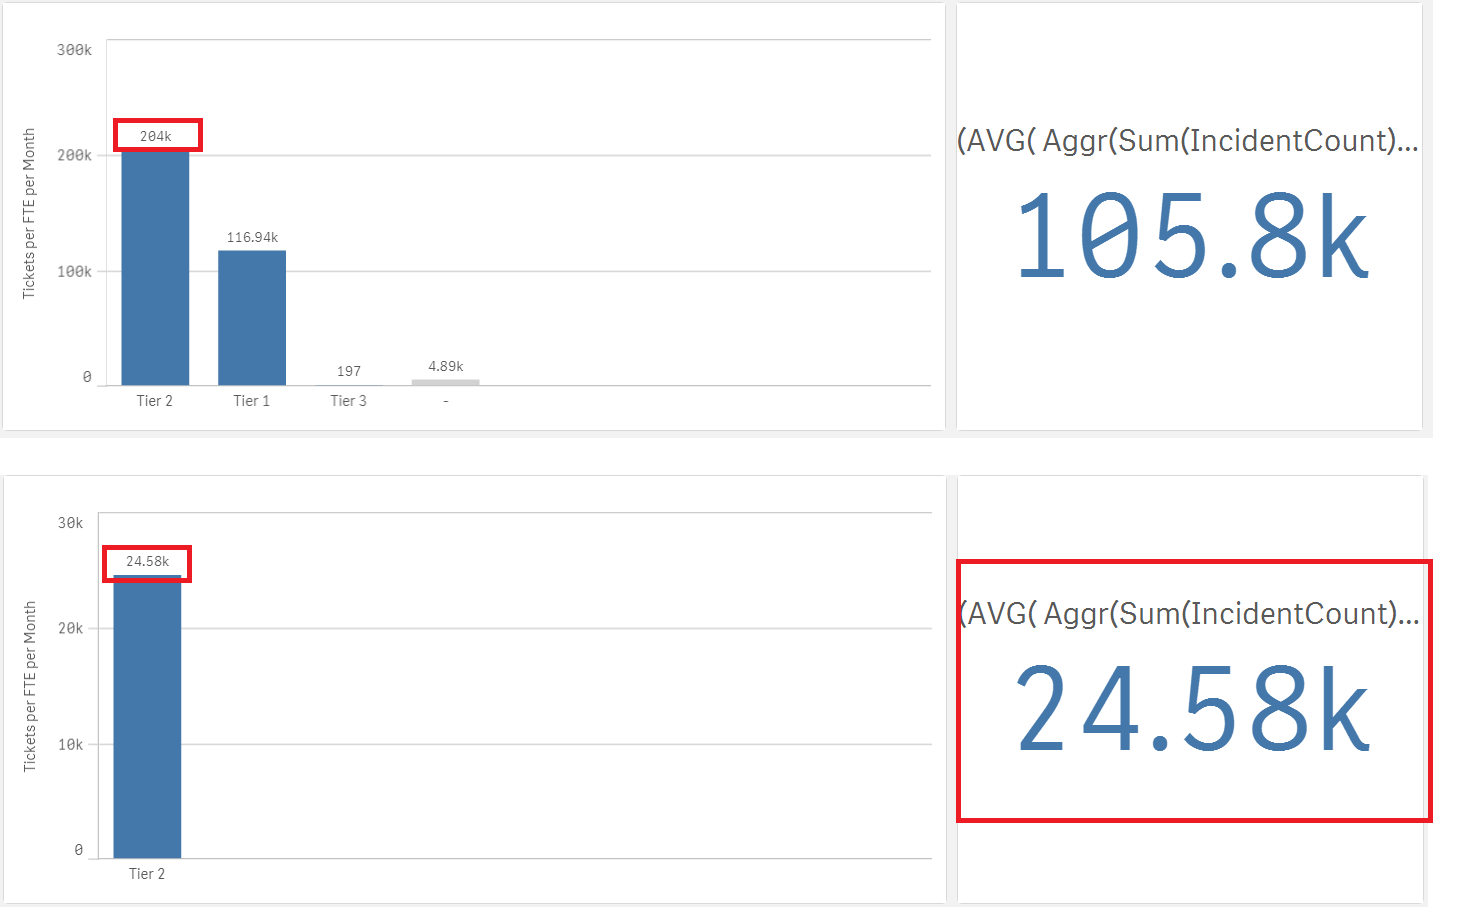
However, when I break this into a dimension, it does not work. Please see below images.
The first image gives me a false number however filtering into it gives me the right number. i.e. 24.58 is the correct average not 204k.
Where am I going wrong?
Accepted Solutions

 agigliotti
- Mark as New
- Bookmark
- Subscribe
- Mute
- Subscribe to RSS Feed
- Permalink
- Report Inappropriate Content
maybe this:
AVG( Aggr( Sum(IncidentCount), yourdimension, Month) )
Follow me on my LinkedIn | Know Gamma Informatica at gammainformatica.it
agigliotti
- Mark as New
- Bookmark
- Subscribe
- Mute
- Subscribe to RSS Feed
- Permalink
- Report Inappropriate Content
maybe this:
AVG( Aggr( Sum(IncidentCount), yourdimension, Month) )
Follow me on my LinkedIn | Know Gamma Informatica at gammainformatica.it

 lironbaram
- Mark as New
- Bookmark
- Subscribe
- Mute
- Subscribe to RSS Feed
- Permalink
- Report Inappropriate Content
hi
when using the aggr function
you need to use the desired dimension but also the chart dimensions
in your case
(AVG(
Aggr(Sum(IncidentCount),Month,TierDimension)
))
replace TierDimension with the real dimension field name