Unlock a world of possibilities! Login now and discover the exclusive benefits awaiting you.
- Qlik Community
- :
- Forums
- :
- Analytics & AI
- :
- Products & Topics
- :
- Visualization and Usability
- :
- Need help on Charting
- Subscribe to RSS Feed
- Mark Topic as New
- Mark Topic as Read
- Float this Topic for Current User
- Bookmark
- Subscribe
- Mute
- Printer Friendly Page
- Mark as New
- Bookmark
- Subscribe
- Mute
- Subscribe to RSS Feed
- Permalink
- Report Inappropriate Content
Need help on Charting
Hi All,
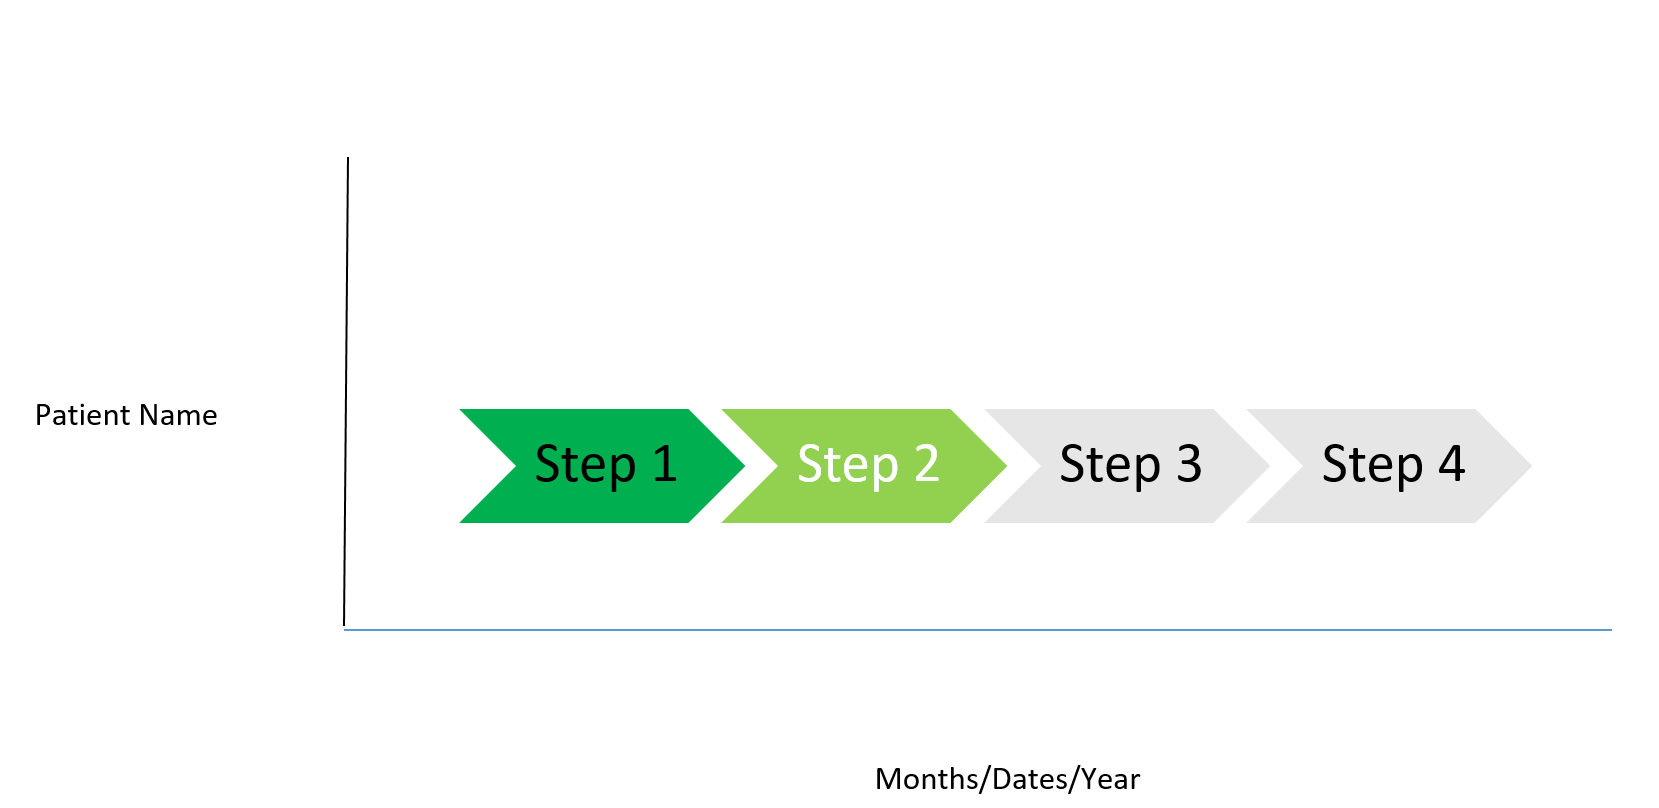
I am dealing with a situation where I need to plot a chart to show the steps user need to take to reach from Point Start to finish. E.g
Lets say I have a Patient A, from enrolling into a Therapy till Delivering the medicine he need to go through say 4 steps.
Patient Name Steps Start Date End Date
A Step 1 1-Jan-2017 10-Jan-2017
Step 2 11-Jan-2017
Step 3 Not Started
Step 4 Not Started
The idea is to show to user that what all levels he already passed and where he is standing today, and post that how many more steps will be coming.
Can someone please help in letting me know which Chart or Extension should I pick to achieve this.
Thx
Ankit
- Tags:
- mike tarallo
- « Previous Replies
-
- 1
- 2
- Next Replies »
- Mark as New
- Bookmark
- Subscribe
- Mute
- Subscribe to RSS Feed
- Permalink
- Report Inappropriate Content
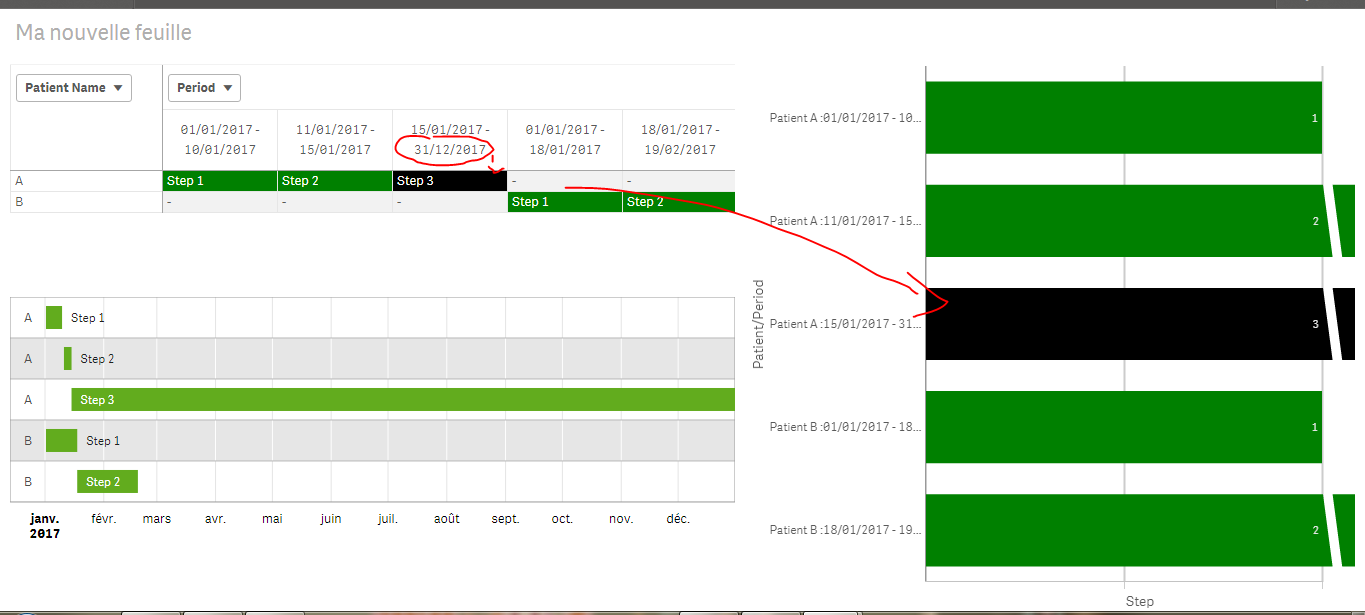
You can also color the steps that are not finished in Black and the finished in green.
The condition would be on the EndDate, if the EndDate>Today() => It's not finished else, finished:
- « Previous Replies
-
- 1
- 2
- Next Replies »