Unlock a world of possibilities! Login now and discover the exclusive benefits awaiting you.
Announcements
Now accepting applications for the Qlik Luminary and Partner Ambassador Programs: Apply by July 6!
- Qlik Community
- :
- Forums
- :
- Analytics & AI
- :
- Products & Topics
- :
- Visualization and Usability
- :
- Percentage Bar Chart does not work when using =mon...
Options
- Subscribe to RSS Feed
- Mark Topic as New
- Mark Topic as Read
- Float this Topic for Current User
- Bookmark
- Subscribe
- Mute
- Printer Friendly Page
Turn on suggestions
Auto-suggest helps you quickly narrow down your search results by suggesting possible matches as you type.
Showing results for
Not applicable
2016-09-05
06:47 AM
- Mark as New
- Bookmark
- Subscribe
- Mute
- Subscribe to RSS Feed
- Permalink
- Report Inappropriate Content
Percentage Bar Chart does not work when using =monthname
Hi everyone,
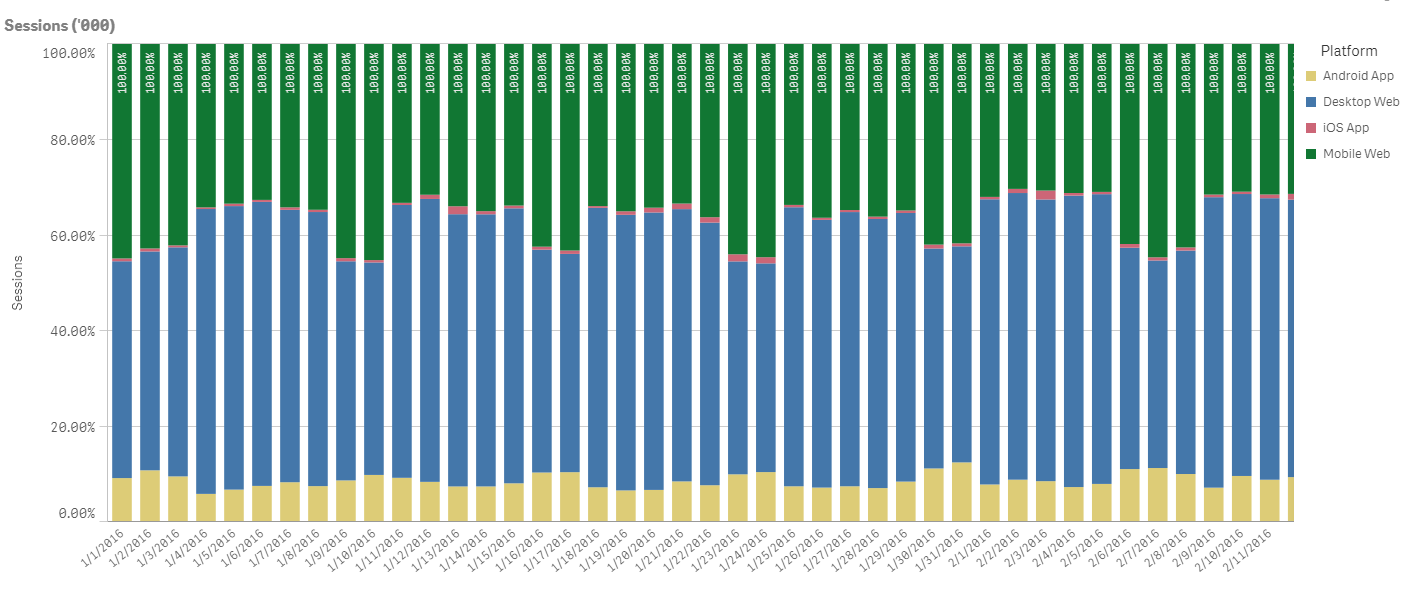
I am making a stacked bar chart and trying to show percentages.
the function is as follows:
Sum(sessions1)/Sum(TOTAL <browse_date> sessions1).
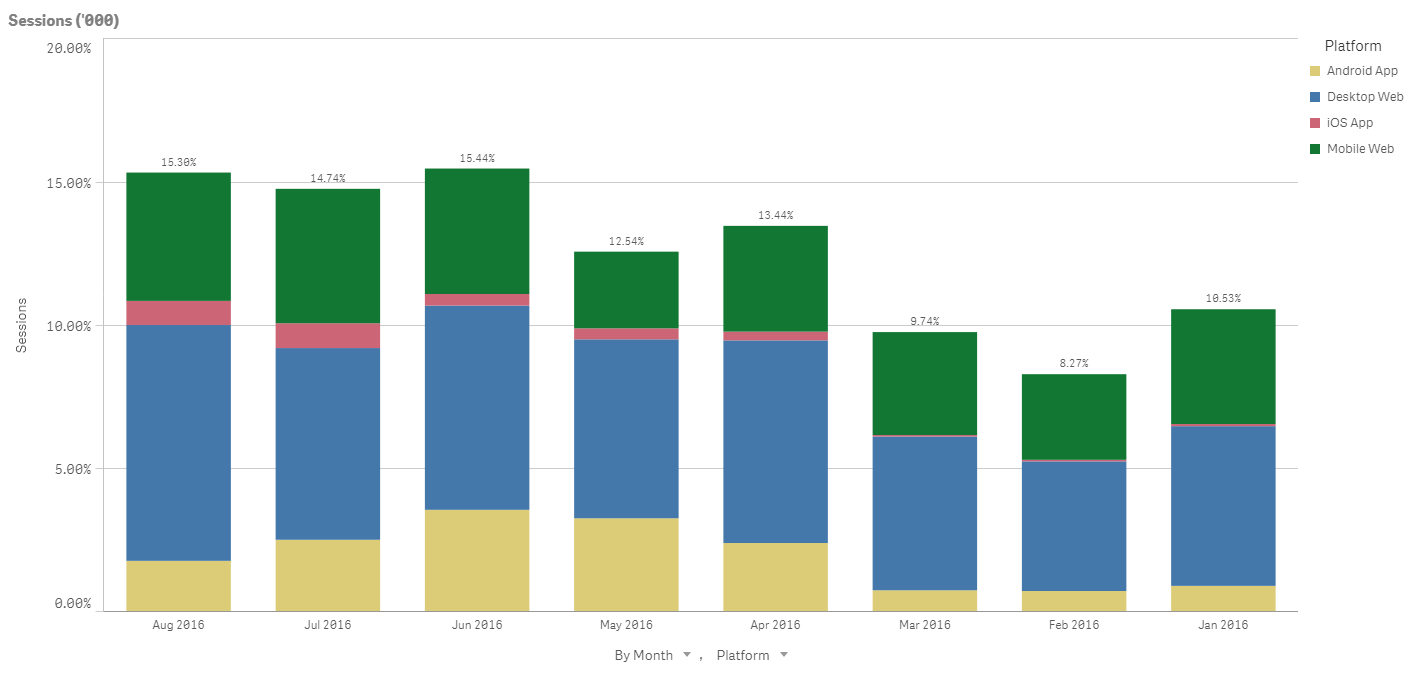
When using the date dimension everything is fine, because each day is measured as 100% (image 1.1), however once i change to =monthname(date) the chart changes into 100% for the total data (image 1.2).
Can someone point out what i might have done wrong?
803 Views
0 Replies