Unlock a world of possibilities! Login now and discover the exclusive benefits awaiting you.

- Qlik Community
- :
- Forums
- :
- Analytics & AI
- :
- Products & Topics
- :
- Visualization and Usability
- :
- Pie Diagram - Time VS Full Day
Options
- Subscribe to RSS Feed
- Mark Topic as New
- Mark Topic as Read
- Float this Topic for Current User
- Bookmark
- Subscribe
- Mute
- Printer Friendly Page
Turn on suggestions
Auto-suggest helps you quickly narrow down your search results by suggesting possible matches as you type.
Showing results for

Anonymous
Not applicable
2018-10-25
08:21 AM
- Mark as New
- Bookmark
- Subscribe
- Mute
- Subscribe to RSS Feed
- Permalink
- Report Inappropriate Content
Pie Diagram - Time VS Full Day
Hi Team
I am currently working on a pie diagram.
I have data with a seconds column.
What i want is the following:
- when the user choose a day, the pie diagramm will show 2 things:
- 1. sum(seconds)
- 2. rest of a day (24 hours * 60 minutes * 60 seconds) - sum(seconds (from above)
Day Filter:
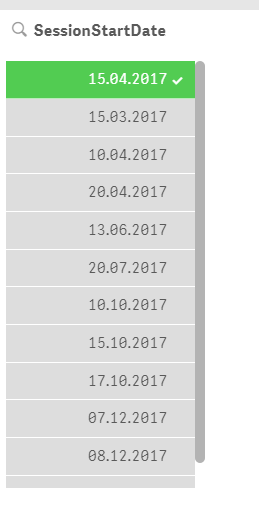
--> Works
Pie Chart:
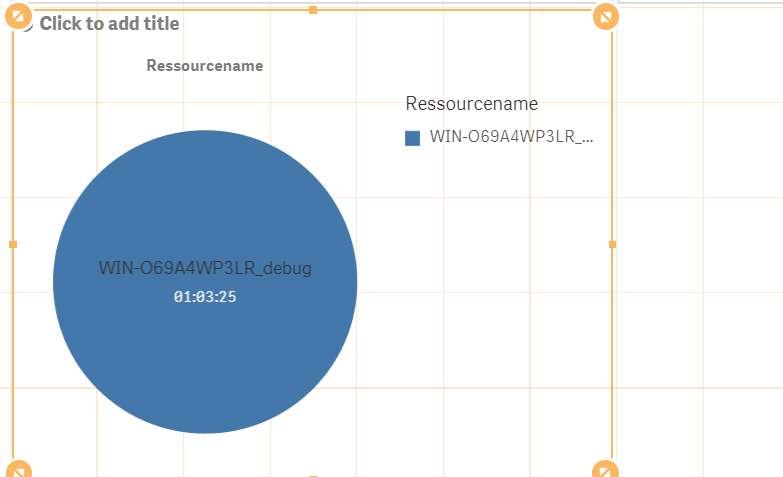
--> Does not work with 24 hours (1day)
I tried to change the following properties:

Can anyone help me to have a pie chart based on 24 hours?
Appreciate any help.
875 Views
0 Replies