Unlock a world of possibilities! Login now and discover the exclusive benefits awaiting you.
- Qlik Community
- :
- Forums
- :
- Analytics & AI
- :
- Products & Topics
- :
- Visualization and Usability
- :
- Pie chart : How to deal with Nulls
- Subscribe to RSS Feed
- Mark Topic as New
- Mark Topic as Read
- Float this Topic for Current User
- Bookmark
- Subscribe
- Mute
- Printer Friendly Page
- Mark as New
- Bookmark
- Subscribe
- Mute
- Subscribe to RSS Feed
- Permalink
- Report Inappropriate Content
Pie chart : How to deal with Nulls
Hi,
I want to make a pie chart by
dimension as State and measure as exposure.
Also I want to show top 5 states on chart and remaining as others. I did this by

My Graph shows
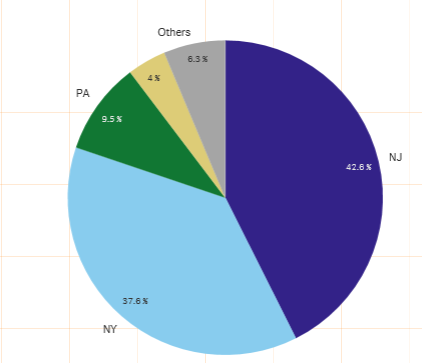
Problem: Here yellow portion which shows 4% are having State value as 'Null'. I want to show these Nulls to include into the 'Others' and want only 5 states with valid value to be displayed. How to do this?
Thanks,
Shweta
- « Previous Replies
-
- 1
- 2
- Next Replies »
- Mark as New
- Bookmark
- Subscribe
- Mute
- Subscribe to RSS Feed
- Permalink
- Report Inappropriate Content
You cannot show null value with others; but I'd propose that u eliminate it from the pie chart as follow:
if(IsNull(YourDim)<>-1, sum(YourMeasure))
and in the title of the chart, mention that the % of your Null values is 4.4%
sthing like:
='NB: Null values represents : '&
(num(sum({<YourDim={"=IsNull(YourDim)=-1"}>}YourMeasure)/ sum(total YourMeasure),'# ##0,00%'))
.
- « Previous Replies
-
- 1
- 2
- Next Replies »