Unlock a world of possibilities! Login now and discover the exclusive benefits awaiting you.
Announcements
Save an extra $150 Dec 1–7 with code CYBERWEEK - stackable with early bird savings: Register
- Qlik Community
- :
- Forums
- :
- Analytics & AI
- :
- Products & Topics
- :
- Visualization and Usability
- :
- Plese help me with setting the scale of the Y-axis...
Options
- Subscribe to RSS Feed
- Mark Topic as New
- Mark Topic as Read
- Float this Topic for Current User
- Bookmark
- Subscribe
- Mute
- Printer Friendly Page
Turn on suggestions
Auto-suggest helps you quickly narrow down your search results by suggesting possible matches as you type.
Showing results for
Contributor III
2023-01-11
03:07 AM
- Mark as New
- Bookmark
- Subscribe
- Mute
- Subscribe to RSS Feed
- Permalink
- Report Inappropriate Content
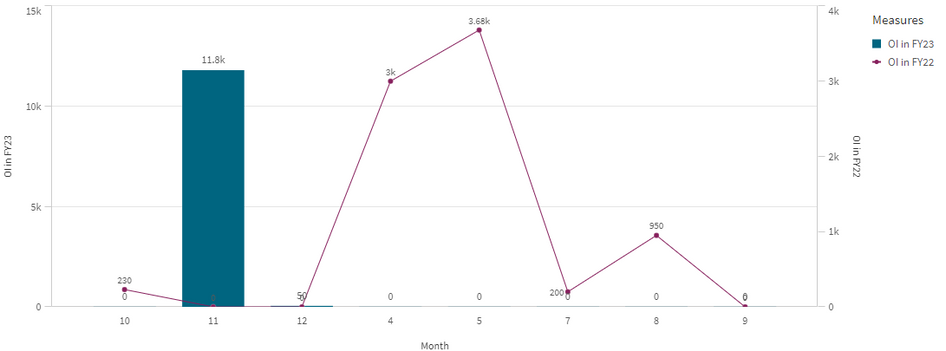
Plese help me with setting the scale of the Y-axis in combo chart
Hi all,
When I draw the chart below in Qlik Sense I found the scale of the two measures are not same(one is 15k the other is 4k), and I don't know how to set the common range of the different measures automatically in the combo chart. Could you help me with it? Any reply would be appreciated! Thank you!
782 Views
1 Reply
Partner - Contributor III
2023-01-17
06:53 AM
- Mark as New
- Bookmark
- Subscribe
- Mute
- Subscribe to RSS Feed
- Permalink
- Report Inappropriate Content
Under Appearance you can use the custom range option to set Min and Max range.

