Unlock a world of possibilities! Login now and discover the exclusive benefits awaiting you.

- Qlik Community
- :
- Forums
- :
- Analytics & AI
- :
- Products & Topics
- :
- Visualization and Usability
- :
- QS: Rolling months in chart
- Subscribe to RSS Feed
- Mark Topic as New
- Mark Topic as Read
- Float this Topic for Current User
- Bookmark
- Subscribe
- Mute
- Printer Friendly Page

- Mark as New
- Bookmark
- Subscribe
- Mute
- Subscribe to RSS Feed
- Permalink
- Report Inappropriate Content
QS: Rolling months in chart
Hi!
Could somebody help me? I am trying to have bar chart where dimension (x-axis) would show past 13 months, not including current month. I have found several answers with Qlik view files and I have Qlik Sense Desktop so haven't been able to utilise them.
Dimension: =MonthName(IncidentReportedMonth)
where IncidentReportedMonth is always the first day of the month
Expressions: count({<[Resolution Category]={Advisory} , [Assigned Group]-={[Group1], [Group2]}>}[Incident ID])
count({<[Resolution Category]={Advisory} , [Assigned Group]={[Group1], [Group2]}>}[Incident ID])
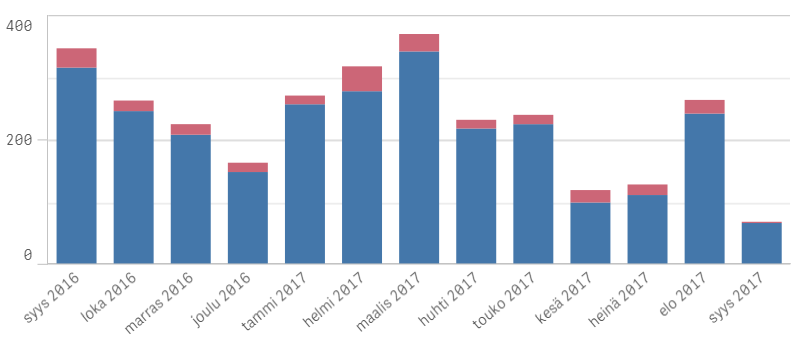
This is otherwise fine, but I don't want this month (syys 2017=Sept 2017) to show and I want to know how can I limit months to 6, 12 or 13 past months so that I don't need to change anything when the month changes (i.e. rolling period).
BR Tiia

 agigliotti
- Mark as New
- Bookmark
- Subscribe
- Mute
- Subscribe to RSS Feed
- Permalink
- Report Inappropriate Content
you could use something like below:
count( {< IncidentReportedMonth = {">=$(=MonthStart(AddMonths(Today(), -13)))<=$(=MonthEnd(AddMonths(Today(), -1)))"}, [Resolution Category]={Advisory} , [Assigned Group]-={[Group1], [Group2]} >} [Incident ID] )
or you can replace value of -13 with a variable the user can input.
Follow me on my LinkedIn | Know Gamma Informatica at gammainformatica.it

 vikasdesai
- Mark as New
- Bookmark
- Subscribe
- Mute
- Subscribe to RSS Feed
- Permalink
- Report Inappropriate Content
Hello ,
Please use following Expression
Sum({<DateField={">=$(=num(Monthstart(max(DateField),-13)))<=$(=num(Monthend(max(DateField),-1)))"},Year=,Month=>} Sales)
Regards
Vikas Desai