Unlock a world of possibilities! Login now and discover the exclusive benefits awaiting you.
- Qlik Community
- :
- Forums
- :
- Analytics & AI
- :
- Products & Topics
- :
- Visualization and Usability
- :
- Qlik Gauge Chart
- Subscribe to RSS Feed
- Mark Topic as New
- Mark Topic as Read
- Float this Topic for Current User
- Bookmark
- Subscribe
- Mute
- Printer Friendly Page
- Mark as New
- Bookmark
- Subscribe
- Mute
- Subscribe to RSS Feed
- Permalink
- Report Inappropriate Content
Qlik Gauge Chart
Hi all,
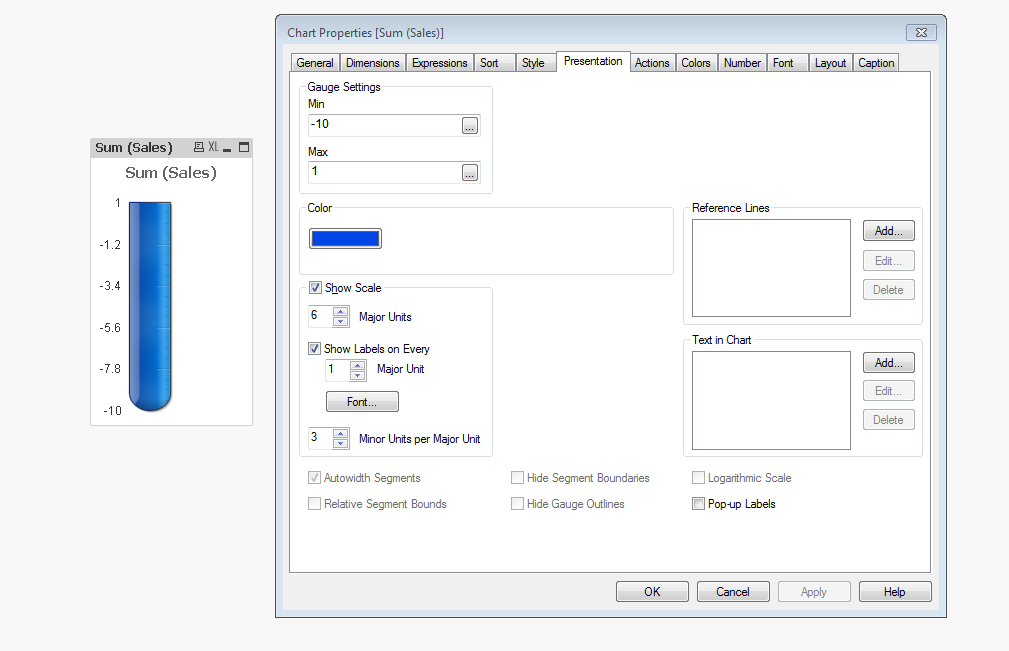
Anyone know how I could rotate this Qlik Gauge around so 10 is at the bottom and 1 is at the top?

- Tags:
- guage chart
Accepted Solutions
- Mark as New
- Bookmark
- Subscribe
- Mute
- Subscribe to RSS Feed
- Permalink
- Report Inappropriate Content
Hi Finban, I'm not sure if this can work but you can try setting the number format to #.##0,00;#.##0,00 (negatives without the '-' sign), set the range of chart from -10 to 0 and swith the sign of the expression using *-1 or -(expression).
Still will draw from botton to top, so maybe you need to switch colors to simulate the same result as if they were positive values.
- Mark as New
- Bookmark
- Subscribe
- Mute
- Subscribe to RSS Feed
- Permalink
- Report Inappropriate Content
I don't think it's possible
- Mark as New
- Bookmark
- Subscribe
- Mute
- Subscribe to RSS Feed
- Permalink
- Report Inappropriate Content
Hi Finban, I'm not sure if this can work but you can try setting the number format to #.##0,00;#.##0,00 (negatives without the '-' sign), set the range of chart from -10 to 0 and swith the sign of the expression using *-1 or -(expression).
Still will draw from botton to top, so maybe you need to switch colors to simulate the same result as if they were positive values.
- Mark as New
- Bookmark
- Subscribe
- Mute
- Subscribe to RSS Feed
- Permalink
- Report Inappropriate Content
Can you share your qvw file?
Thanks
- Mark as New
- Bookmark
- Subscribe
- Mute
- Subscribe to RSS Feed
- Permalink
- Report Inappropriate Content
If somehow we can rename -10 as 10. Ruben please advise on this.
- Mark as New
- Bookmark
- Subscribe
- Mute
- Subscribe to RSS Feed
- Permalink
- Report Inappropriate Content
Chart properties -> Number tab, set number format as #.##0,00;#.##0,00
- Mark as New
- Bookmark
- Subscribe
- Mute
- Subscribe to RSS Feed
- Permalink
- Report Inappropriate Content
Can you show us?
Thanks
- Mark as New
- Bookmark
- Subscribe
- Mute
- Subscribe to RSS Feed
- Permalink
- Report Inappropriate Content
PFA.
- Mark as New
- Bookmark
- Subscribe
- Mute
- Subscribe to RSS Feed
- Permalink
- Report Inappropriate Content
Thank you 