Unlock a world of possibilities! Login now and discover the exclusive benefits awaiting you.
- Qlik Community
- :
- Forums
- :
- Analytics & AI
- :
- Products & Topics
- :
- Visualization and Usability
- :
- Qlik Sense API
- Subscribe to RSS Feed
- Mark Topic as New
- Mark Topic as Read
- Float this Topic for Current User
- Bookmark
- Subscribe
- Mute
- Printer Friendly Page
- Mark as New
- Bookmark
- Subscribe
- Mute
- Subscribe to RSS Feed
- Permalink
- Report Inappropriate Content
Qlik Sense API
Hi!
I want to pull data and images from Qlik Sense into my application.
Is there any APIs for Qlik Sense?
Thanks!
Accepted Solutions
- Mark as New
- Bookmark
- Subscribe
- Mute
- Subscribe to RSS Feed
- Permalink
- Report Inappropriate Content
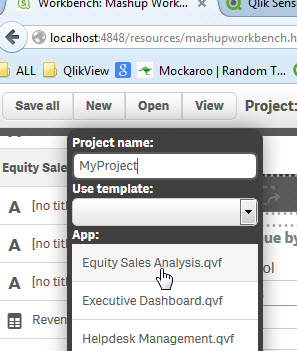
Hello Andrew - you can get a preview of what this will be like with Qlik Sense Server by starting Sense Desktop, opening a browser and visiting this URL:http://localhost:4848/resources/mashupworkbench.html
Click the New Button, Enter in a Project Name, Select an existing app in the list and a simple layout design will open where you can drag in the visualization objects you created:
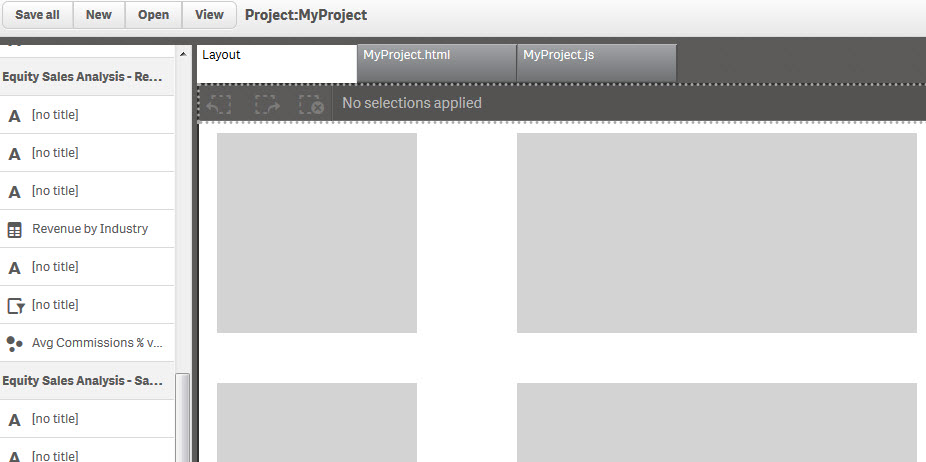
This is an early example of what you can do using the APIs, this tool uses a simple layout editor and is meant to demonstrate how the div layers are used to house the chart objects.
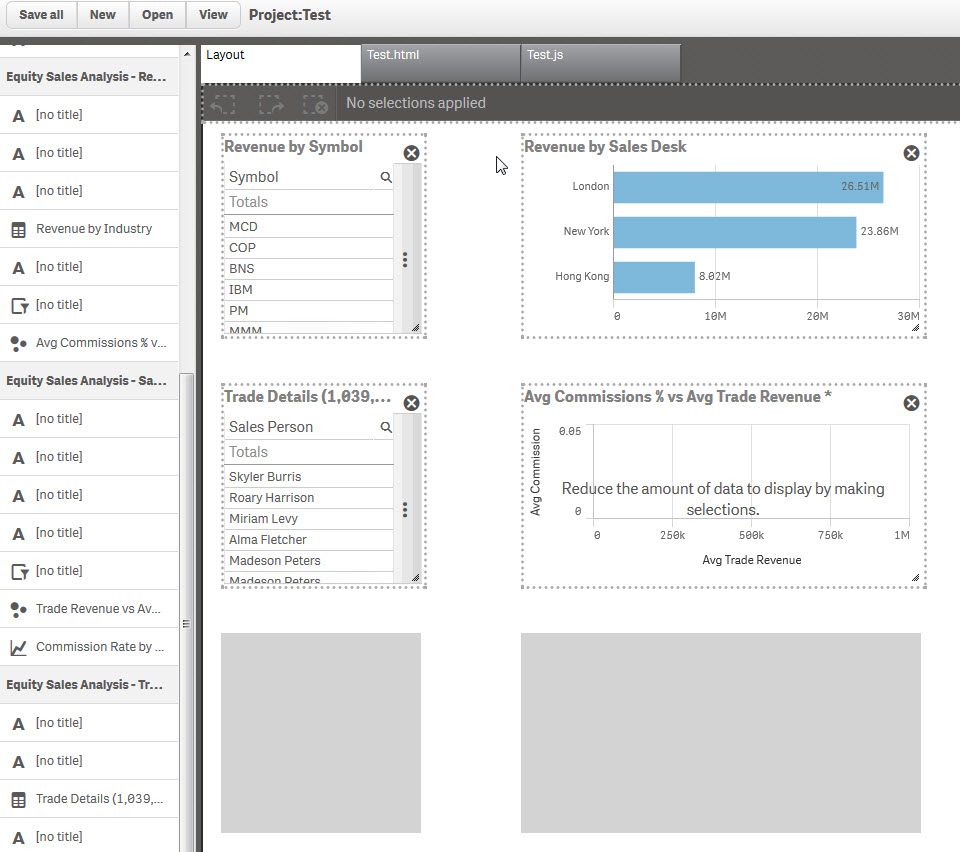
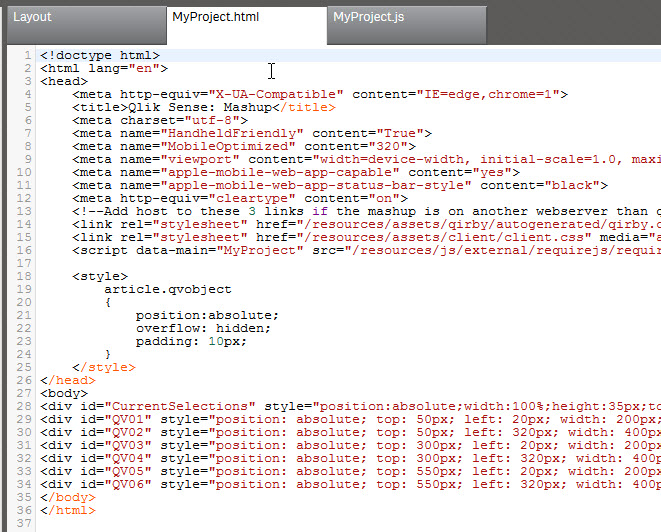
If you have some apps created - you can take their contents (chart objects, list boxes, images) and lay them out and view the JavaScript and HTML code used:
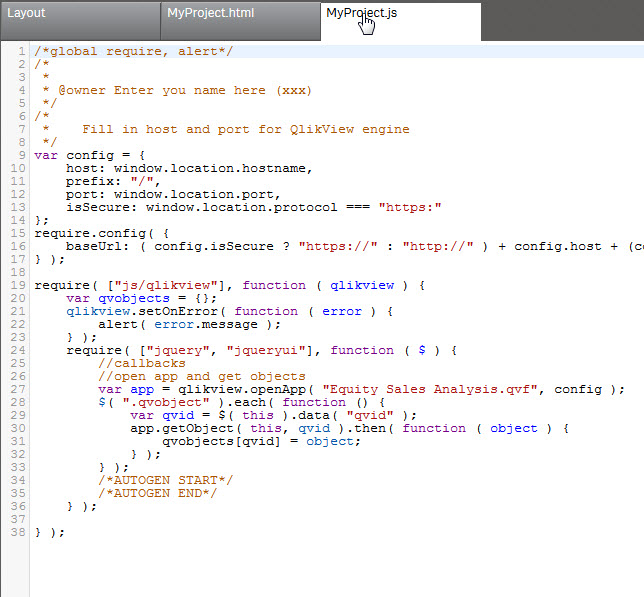
Hope this helps
Mike Tarallo
Qlik
- Mark as New
- Bookmark
- Subscribe
- Mute
- Subscribe to RSS Feed
- Permalink
- Report Inappropriate Content
Qlik Sense Desktop does not provide any APIs. Keep an eye out for this in the server version though, looks like it will be a major focus area!
- Mark as New
- Bookmark
- Subscribe
- Mute
- Subscribe to RSS Feed
- Permalink
- Report Inappropriate Content
Hello Andrew - you can get a preview of what this will be like with Qlik Sense Server by starting Sense Desktop, opening a browser and visiting this URL:http://localhost:4848/resources/mashupworkbench.html
Click the New Button, Enter in a Project Name, Select an existing app in the list and a simple layout design will open where you can drag in the visualization objects you created:
This is an early example of what you can do using the APIs, this tool uses a simple layout editor and is meant to demonstrate how the div layers are used to house the chart objects.
If you have some apps created - you can take their contents (chart objects, list boxes, images) and lay them out and view the JavaScript and HTML code used:
Hope this helps
Mike Tarallo
Qlik