Unlock a world of possibilities! Login now and discover the exclusive benefits awaiting you.

- Qlik Community
- :
- Forums
- :
- Analytics & AI
- :
- Products & Topics
- :
- Visualization and Usability
- :
- QlikSense: Chart Show latest 26 Weeks
Options
- Subscribe to RSS Feed
- Mark Topic as New
- Mark Topic as Read
- Float this Topic for Current User
- Bookmark
- Subscribe
- Mute
- Printer Friendly Page
Turn on suggestions
Auto-suggest helps you quickly narrow down your search results by suggesting possible matches as you type.
Showing results for

 steve1982
Contributor II
2019-02-18
08:19 PM
- Mark as New
- Bookmark
- Subscribe
- Mute
- Subscribe to RSS Feed
- Permalink
- Report Inappropriate Content
QlikSense: Chart Show latest 26 Weeks
Hi,
I has a line chart which Fiscal Week is dimension. The current graph show all the fiscal week value. I need the graph to show latest 26 weeks. For example, this week is 201907, the graph will show from 201834 to 201907.
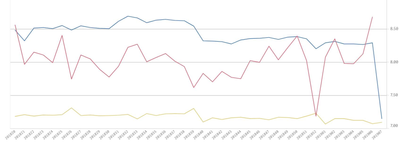
Thanks
Steve
718 Views
1 Reply

 Channa
Specialist III
2019-02-20
01:57 AM
- Mark as New
- Bookmark
- Subscribe
- Mute
- Subscribe to RSS Feed
- Permalink
- Report Inappropriate Content
sum({<Date={‘>=$(=WeekStart(Max(Date), -25))<=$(=Date(Max(Date)))’}>} Sales )
try this
Channa
696 Views
