Unlock a world of possibilities! Login now and discover the exclusive benefits awaiting you.
- Qlik Community
- :
- Forums
- :
- Analytics & AI
- :
- Products & Topics
- :
- Visualization and Usability
- :
- QlikSense Map with multiple geoinfo visualizations
- Subscribe to RSS Feed
- Mark Topic as New
- Mark Topic as Read
- Float this Topic for Current User
- Bookmark
- Subscribe
- Mute
- Printer Friendly Page
- Mark as New
- Bookmark
- Subscribe
- Mute
- Subscribe to RSS Feed
- Permalink
- Report Inappropriate Content
QlikSense Map with multiple geoinfo visualizations
Hello,
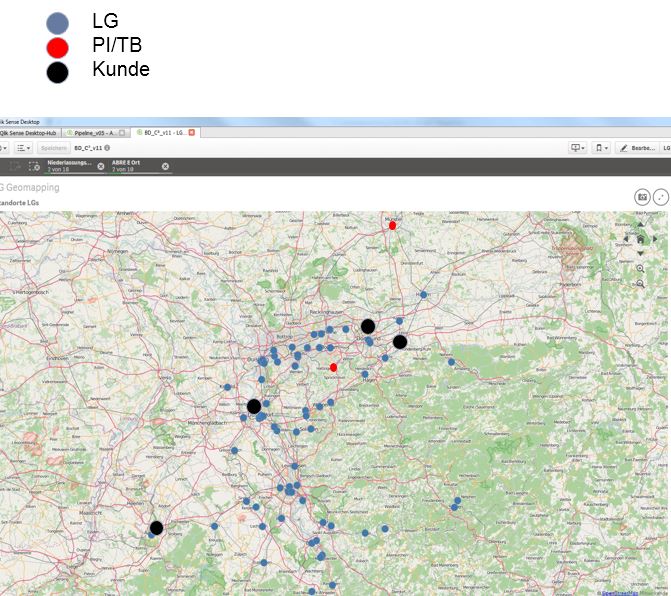
is it possible to visualize 3 dimensions in the Qlik Sense Map Extension?
The screenshot (photoshop) shows what we're aiming for. We want to visualize/overlay the geo coordinates based on adress data (postal code/city) of our customers, project engineers and real estates, so that we can distribute our field workers logistically across the country and states most efficiently.
If it's not possible with the standard Qlik Sense map extension (what i'm guessing, since i've only managed to visualize one dimension on the map), are there any other extensions that can handle it?
- Mark as New
- Bookmark
- Subscribe
- Mute
- Subscribe to RSS Feed
- Permalink
- Report Inappropriate Content
Hi Gino,
You can tweak your datamodel to merge the data points in one single dimension and with an extra column to define the dimension type you can set the bubble colors.
- Mark as New
- Bookmark
- Subscribe
- Mute
- Subscribe to RSS Feed
- Permalink
- Report Inappropriate Content
This link is might be helpful for tou but it is using SVGs instead of a map and you have to create your svgs on your own, but you can use multi dimensions and measures in it.