Unlock a world of possibilities! Login now and discover the exclusive benefits awaiting you.

- Qlik Community
- :
- Forums
- :
- Analytics & AI
- :
- Products & Topics
- :
- Visualization and Usability
- :
- QlikSense Sankey Diagram Help
Options
- Subscribe to RSS Feed
- Mark Topic as New
- Mark Topic as Read
- Float this Topic for Current User
- Bookmark
- Subscribe
- Mute
- Printer Friendly Page
Turn on suggestions
Auto-suggest helps you quickly narrow down your search results by suggesting possible matches as you type.
Showing results for

 albertestrada
Contributor II
2017-04-24
05:16 PM
- Mark as New
- Bookmark
- Subscribe
- Mute
- Subscribe to RSS Feed
- Permalink
- Report Inappropriate Content
QlikSense Sankey Diagram Help
Hello ,
I have three fields: Pattern / Month / Value
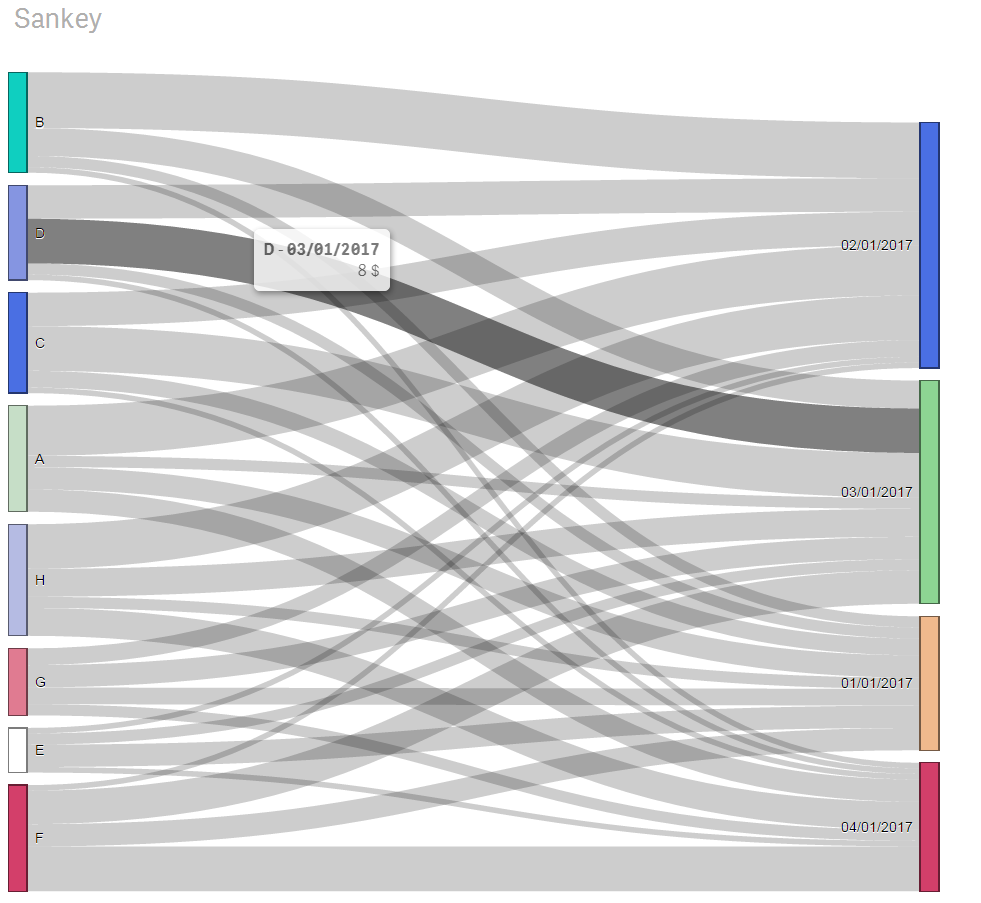
I would like to display thru Sankey Diagram a month over month movement in the Pattern. Therefore, the Sankey would have Two Dimensions: Pattern_-1 month and Pattern_Current Month
- I can show Dimensions Pattern and Date as you see below, but I would prefer to only display Pattern prior month and Pattern current month.
- I tried a set analysis for current month but did not work: Aggr(Only({<Date={'04/01/2017'}>} Pattern ), Pattern)
Any guidance will be appreciated.
1,952 Views
0 Replies
