Unlock a world of possibilities! Login now and discover the exclusive benefits awaiting you.
- Qlik Community
- :
- Forums
- :
- Analytics & AI
- :
- Products & Topics
- :
- Visualization and Usability
- :
- Re: Possible to add a trend line to a scatter plot...
- Subscribe to RSS Feed
- Mark Topic as New
- Mark Topic as Read
- Float this Topic for Current User
- Bookmark
- Subscribe
- Mute
- Printer Friendly Page
- Mark as New
- Bookmark
- Subscribe
- Mute
- Subscribe to RSS Feed
- Permalink
- Report Inappropriate Content
Re: Possible to add a trend line to a scatter plot in QlikSense?
The formula editor for the reference line doesn't seems to accept formula like explained in the post you mentioned, here: Possible to add a trend line to a scatter plot in QlikSense?
Is there any other way to do it ?
Kind Regards
Hugo
- Mark as New
- Bookmark
- Subscribe
- Mute
- Subscribe to RSS Feed
- Permalink
- Report Inappropriate Content
Hello Hugo,
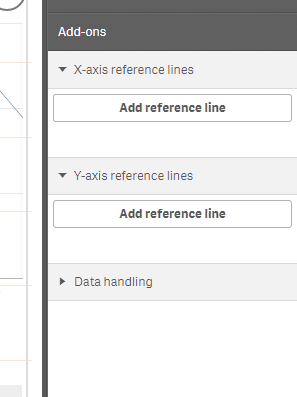
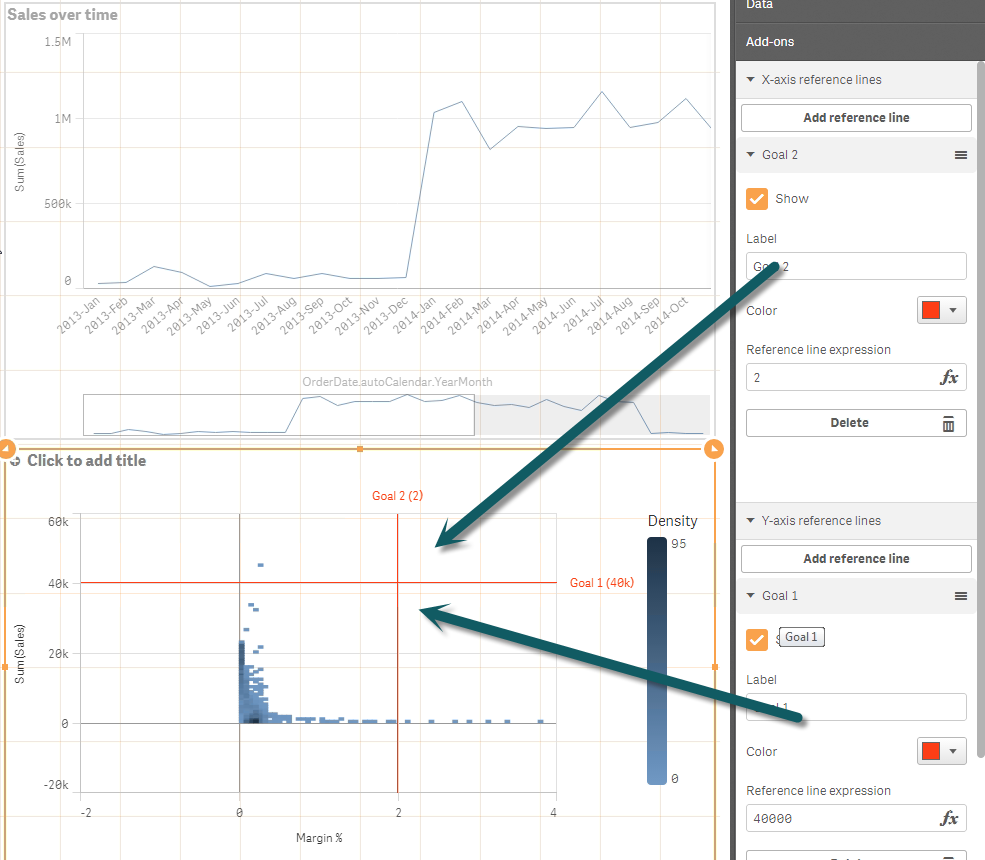
I believe that is because scatter plots DO NOT SUPPORT the use of a reference line exactly the same way as another type of chart, however you can do this - I just tested in Qlik Sense 2.2 and I see the following under add on:
You can also do something similar wit a calculated expression as another measure: Check out the solution here if you wish:
Re: How to add lineal trend in Qlik sense
Let us know how you do.
Please mark the appropriate replies as CORRECT / HELPFUL so our team and other members know that your question(s) has been answered to your satisfaction.
Regards,
Mike Tarallo
Qlik
Mike Tarallo
Qlik
- Mark as New
- Bookmark
- Subscribe
- Mute
- Subscribe to RSS Feed
- Permalink
- Report Inappropriate Content
Hi Robellaz,
As Michael suggested, you can have reference lines as shown, if you would like to have a regression line or an other measure to be plotted as a line on the scatter plot you will have to go with an extension.
Thanks,
Sangram.