Unlock a world of possibilities! Login now and discover the exclusive benefits awaiting you.

- Qlik Community
- :
- Forums
- :
- Analytics & AI
- :
- Products & Topics
- :
- Visualization and Usability
- :
- Re: Rolling 12Months for Sales in Bar Chart
- Subscribe to RSS Feed
- Mark Topic as New
- Mark Topic as Read
- Float this Topic for Current User
- Bookmark
- Subscribe
- Mute
- Printer Friendly Page

- Mark as New
- Bookmark
- Subscribe
- Mute
- Subscribe to RSS Feed
- Permalink
- Report Inappropriate Content
Rolling 12Months for Sales in Bar Chart
Hello Team,
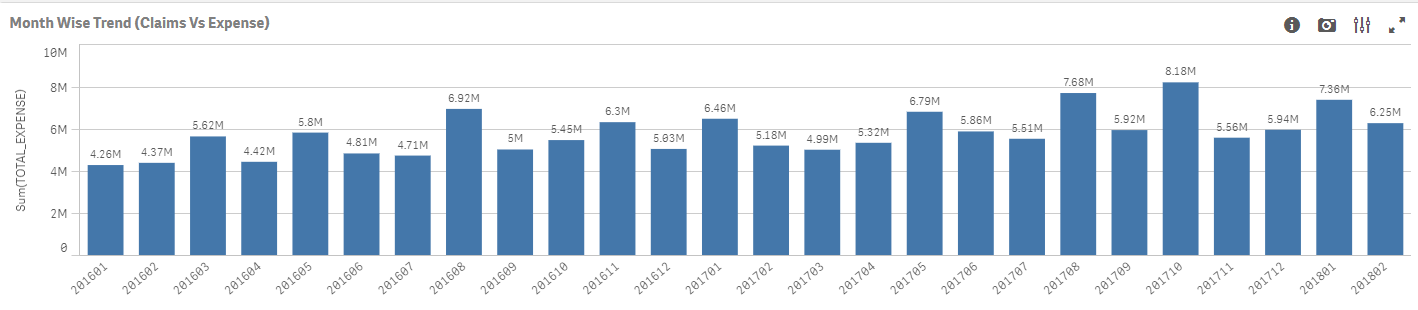
I am trying to show only last 12 months Total_Expense measure value in bar chart... X-Axis = YYYYMM & Y-Axis= Sum of Total Expense.
I am using Sum(TOTAL_EXPENSE) expression in measure value..
Format is YYYYMM, which data used to.
Can any one help me find out expression which i can use for last 12 rolling months in the bar chart..
- « Previous Replies
- Next Replies »

 YoussefBelloum
- Mark as New
- Bookmark
- Subscribe
- Mute
- Subscribe to RSS Feed
- Permalink
- Report Inappropriate Content
here it is
PFA
YoussefBelloum
- Mark as New
- Bookmark
- Subscribe
- Mute
- Subscribe to RSS Feed
- Permalink
- Report Inappropriate Content
I was just forgetting to change the date format of your field inside the set analysis...
- Mark as New
- Bookmark
- Subscribe
- Mute
- Subscribe to RSS Feed
- Permalink
- Report Inappropriate Content
can you send me again QVW with date format updated...
YoussefBelloum
- Mark as New
- Bookmark
- Subscribe
- Mute
- Subscribe to RSS Feed
- Permalink
- Report Inappropriate Content
It was already updated on the above QVW..I just added a comment to tell why my previous answers didn't work for you
- Mark as New
- Bookmark
- Subscribe
- Mute
- Subscribe to RSS Feed
- Permalink
- Report Inappropriate Content
now shall i use
Sum( {<CLAIM_YEARMONTH={">=$(=AddMonths(Max(Date(Date#(CLAIM_YEARMONTH,'YYYYMM'),'YYYYMM')),-12))<=$(=Max(Date(Date#(CLAIM_YEARMONTH,'YYYYMM'),'YYYYMM')))"}>} TOTAL_EXPENSE)
in the Total_Expense(Measure) Expression?
YoussefBelloum
- Mark as New
- Bookmark
- Subscribe
- Mute
- Subscribe to RSS Feed
- Permalink
- Report Inappropriate Content
No, this one is not correct becausse it is not complete..
If you already opened the QVW I send above and the output is fine for you, just use this:
=Sum( {<CLAIM_YEARMONTH={">=$(=Date(AddMonths(Max(CLAIM_YEARMONTH),-12),'YYYYMM'))<=$(=Max(CLAIM_YEARMONTH))"}>} TOTAL_EXPENSE)
PS: don't forget to take a look at the script to see how I altered the loading of the CLAIM_YEARMONTH field, you will have to do the same in your script.
hope it is clear

 sasiparupudi1
- Mark as New
- Bookmark
- Subscribe
- Mute
- Subscribe to RSS Feed
- Permalink
- Report Inappropriate Content
Sum({<CLAIM_YEARMONTH={">=$(=Date(Addmonths(Date#(MAX(CLAIM_YEARMONTH),'YYYYMM'),-12),'YYYYMM'))<=$(=Max(CLAIM_YEARMONTH))"}>}TOTAL_EXPENSES)
- Mark as New
- Bookmark
- Subscribe
- Mute
- Subscribe to RSS Feed
- Permalink
- Report Inappropriate Content
Thanks Youssef, it works now... I changed the script while loading with date() format... Then expression works for 12months rolling.
Thankyou once again...
- « Previous Replies
- Next Replies »