Unlock a world of possibilities! Login now and discover the exclusive benefits awaiting you.

Announcements
Want to see what's currently in public preview? We've pulled it all together in one place. Check it out here
- Qlik Community
- :
- Forums
- :
- Analytics & AI
- :
- Products & Topics
- :
- Visualization and Usability
- :
- Set ranges for QlikSense chart
Options
- Subscribe to RSS Feed
- Mark Topic as New
- Mark Topic as Read
- Float this Topic for Current User
- Bookmark
- Subscribe
- Mute
- Printer Friendly Page
Turn on suggestions
Auto-suggest helps you quickly narrow down your search results by suggesting possible matches as you type.
Showing results for

 krissy_s
Contributor III
2019-07-18
01:40 AM
- Mark as New
- Bookmark
- Subscribe
- Mute
- Subscribe to RSS Feed
- Permalink
- Report Inappropriate Content
Set ranges for QlikSense chart
I would like to set numerical ranges for a measure I have created
i.e.
1 - 7 days
8 - 14 days
14 - 21 days
21 - 30 days
30 - 60 days
And i would like to show the number of records which fall into each of these ranges, and display the data on a chart.
1,209 Views
1 Solution
Accepted Solutions
 thomasmercer
Contributor III
2019-07-18
01:53 AM
- Mark as New
- Bookmark
- Subscribe
- Mute
- Subscribe to RSS Feed
- Permalink
- Report Inappropriate Content
Hi Kristen,
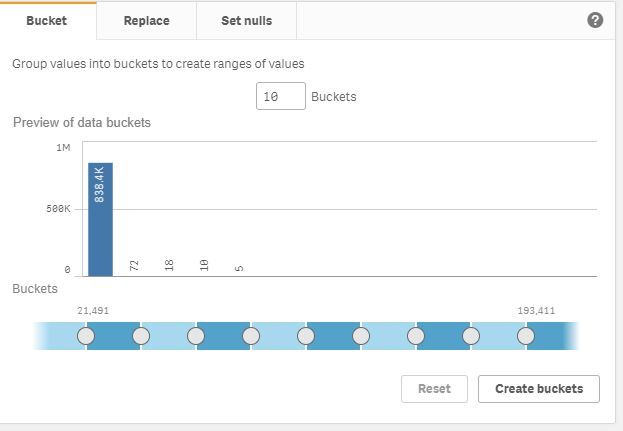
You can do this by creating data buckets, then using the new measure. See below:
This can be achieved in data manager for numerical fields:
1 Reply
thomasmercer
Contributor III
2019-07-18
01:53 AM
- Mark as New
- Bookmark
- Subscribe
- Mute
- Subscribe to RSS Feed
- Permalink
- Report Inappropriate Content
Hi Kristen,
You can do this by creating data buckets, then using the new measure. See below:
This can be achieved in data manager for numerical fields:
