Unlock a world of possibilities! Login now and discover the exclusive benefits awaiting you.

- Qlik Community
- :
- Forums
- :
- Analytics & AI
- :
- Products & Topics
- :
- Visualization and Usability
- :
- Simple LineGraph
- Subscribe to RSS Feed
- Mark Topic as New
- Mark Topic as Read
- Float this Topic for Current User
- Bookmark
- Subscribe
- Mute
- Printer Friendly Page

 Enki
Enki
- Mark as New
- Bookmark
- Subscribe
- Mute
- Subscribe to RSS Feed
- Permalink
- Report Inappropriate Content
Simple LineGraph
Hey,
I am pretty new to Qlikview and have tried to display something using some videos and different forum posts.
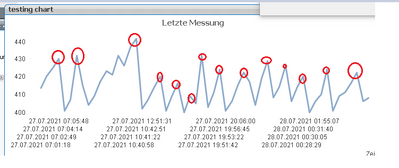
What i am trying to do is to create a simple linegraph chart , but only displaying the highest values within that linegraph. I tried to use stuff like: above,below,after,before,peek functions but still didn't manage to display it.
Can someone help me what function i have to use so that only the 'peek' values are shows in my linegraph?
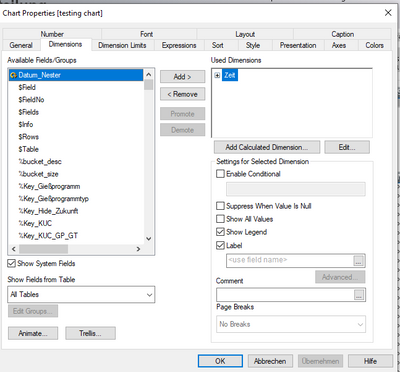
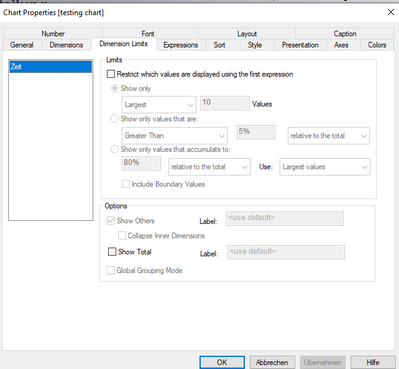
in the pictures you can see my current settings and displayed graph.
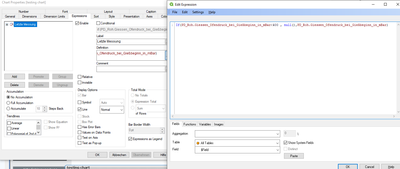
My current expression is:
If(PD_Roh.Giessen_Ofendruck_bei_Gießbeginn_in_mBar<400 ,null(),PD_Roh.Giessen_Ofendruck_bei_Gießbeginn_in_mBar)
Enki
- Mark as New
- Bookmark
- Subscribe
- Mute
- Subscribe to RSS Feed
- Permalink
- Report Inappropriate Content
The Expression is very bad see so i have added an extra picture.

