Unlock a world of possibilities! Login now and discover the exclusive benefits awaiting you.

- Qlik Community
- :
- Forums
- :
- Analytics & AI
- :
- Products & Topics
- :
- Visualization and Usability
- :
- Sloped Reference Line Going to Zero
- Subscribe to RSS Feed
- Mark Topic as New
- Mark Topic as Read
- Float this Topic for Current User
- Bookmark
- Subscribe
- Mute
- Printer Friendly Page

 pdlnfool
- Mark as New
- Bookmark
- Subscribe
- Mute
- Subscribe to RSS Feed
- Permalink
- Report Inappropriate Content
Sloped Reference Line Going to Zero
Good day all!
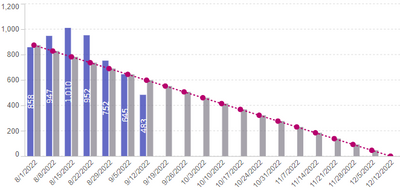
I am trying to add a measure to a chart to generate a sloped line or "glide slope" which starts at the value on the first date and goes to 0 at a certain date as shown in the graph below. I hand jammed the values for the red line, but would like to use the same idea for other graphs, so using a function or formula would be ideal. Even using a fitted line but forcing to zero would be fine.
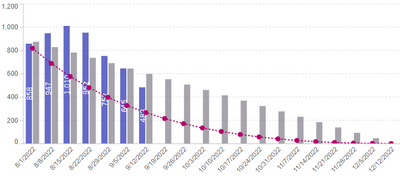
I'm thinking I could use the LinEst_M function and force the line to pass through the x-axis at the end date (when y is zero) but get a curved line and the y axis starting value is not correct.
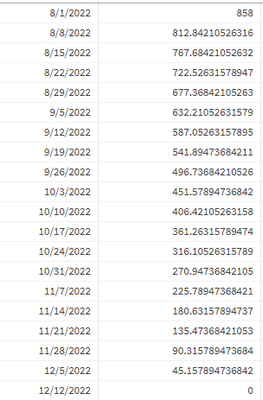
In another attempt, I divided the value from the first date by the number of weeks of data, which gives me the slope. I then multiplied the slope by the week number of data (week 1, week 2, etc) and subtracted that from the first value. This gave me the correct values...
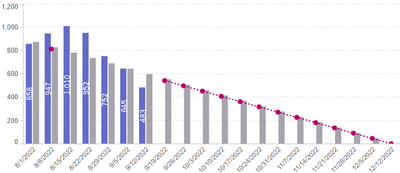
But using the same formula in the chart causes a broken line for some reason. It seems Qlik doesn't like the calculation with the Week() function. To troubleshoot, I replaced the Week() function with a number and the line is no longer broken (but obviously gives the wrong data).
Any insight would be appreciated. Thank you!
Chris
