Unlock a world of possibilities! Login now and discover the exclusive benefits awaiting you.

- Qlik Community
- :
- Forums
- :
- Analytics & AI
- :
- Products & Topics
- :
- Visualization and Usability
- :
- Stacked Bar Chart Set Analysis
Options
- Subscribe to RSS Feed
- Mark Topic as New
- Mark Topic as Read
- Float this Topic for Current User
- Bookmark
- Subscribe
- Mute
- Printer Friendly Page
Turn on suggestions
Auto-suggest helps you quickly narrow down your search results by suggesting possible matches as you type.
Showing results for

 eaphymaoweave
Contributor II
2018-02-06
09:29 AM
- Mark as New
- Bookmark
- Subscribe
- Mute
- Subscribe to RSS Feed
- Permalink
- Report Inappropriate Content
Stacked Bar Chart Set Analysis
Hello community!
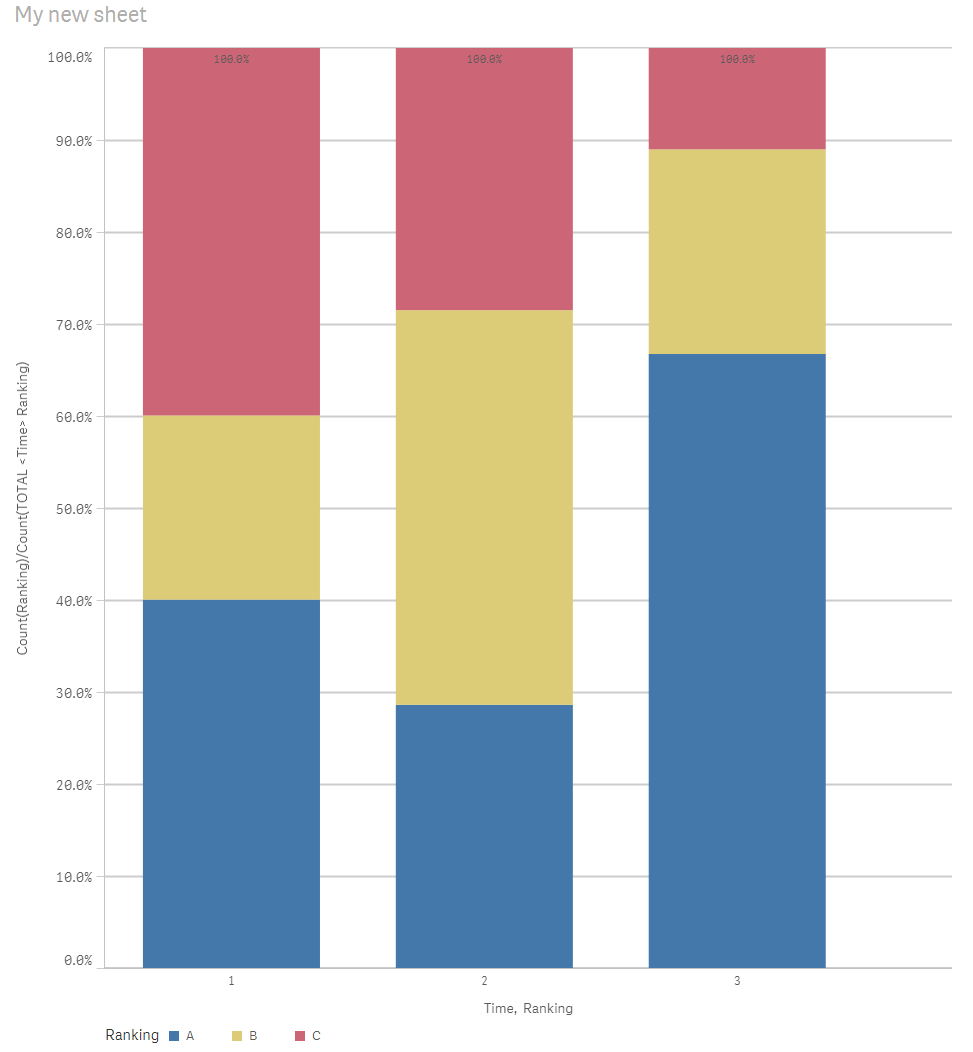
I'm trying to build a stacked bar chart that shows the count of the ranking divided by the total count of rankings for a distinct time period. My data is similar to the below. I have a stacked bar chart with time and ranking as dimensions, but i'm struggling to get the measure right. Ideally I would have 3 bars totally to 100% each and the ABC's for each time bar would add up to the 100%.
| Time | Ranking |
| 1 | A |
| 1 | A |
| 1 | B |
| 1 | C |
| 1 | C |
| 2 | A |
| 2 | B |
| 2 | B |
| 2 | B |
| 2 | C |
| 2 | C |
| 2 | A |
| 3 | A |
| 3 | A |
| 3 | A |
| 3 | A |
| 3 | B |
| 3 | A |
| 3 | A |
| 3 | C |
| 3 | B |
Any help would be greatly appreciated.
1,700 Views
1 Solution
Accepted Solutions

 sunny_talwar
MVP
2018-02-06
09:44 AM
- Mark as New
- Bookmark
- Subscribe
- Mute
- Subscribe to RSS Feed
- Permalink
- Report Inappropriate Content
May be this
Dimension
Time
Ranking
Expression
Count(Ranking)/Count(TOTAL <Time> Ranking)
1 Reply
sunny_talwar
MVP
2018-02-06
09:44 AM
- Mark as New
- Bookmark
- Subscribe
- Mute
- Subscribe to RSS Feed
- Permalink
- Report Inappropriate Content
May be this
Dimension
Time
Ranking
Expression
Count(Ranking)/Count(TOTAL <Time> Ranking)
