Unlock a world of possibilities! Login now and discover the exclusive benefits awaiting you.
- Qlik Community
- :
- Forums
- :
- Analytics & AI
- :
- Products & Topics
- :
- Visualization and Usability
- :
- Stacked Bar Chart Two Dimensions Cumulated Values
- Subscribe to RSS Feed
- Mark Topic as New
- Mark Topic as Read
- Float this Topic for Current User
- Bookmark
- Subscribe
- Mute
- Printer Friendly Page
- Mark as New
- Bookmark
- Subscribe
- Mute
- Subscribe to RSS Feed
- Permalink
- Report Inappropriate Content
Stacked Bar Chart Two Dimensions Cumulated Values
Hi, I want to create a Stacked bar chart in Qlik Sense with cumulative values using two dimensions. Is this possible? We had one in QlikView and it looked like the attached image. I tried to use Rangesum(Above([Expression],0,rowno())) but it didn´t work.
- « Previous Replies
-
- 1
- 2
- Next Replies »
Accepted Solutions
- Mark as New
- Bookmark
- Subscribe
- Mute
- Subscribe to RSS Feed
- Permalink
- Report Inappropriate Content
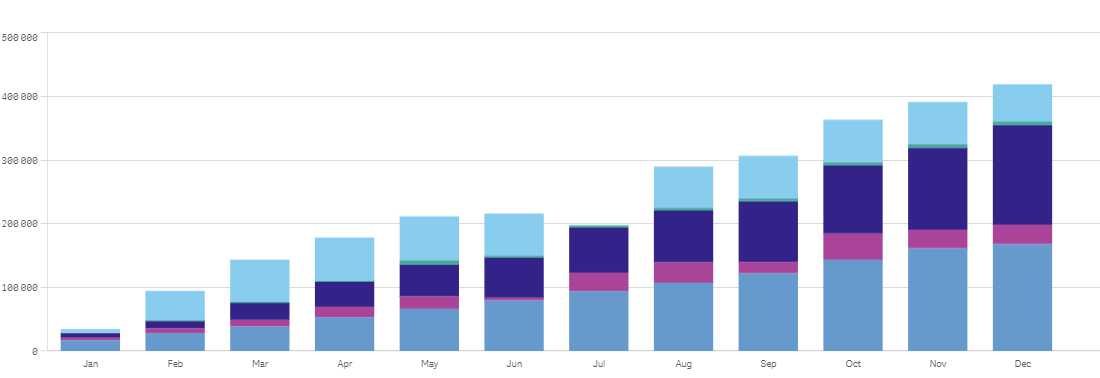
Mine seems correct, and in your screenshot E has 400k, wich is correct with his Y axis, maybe you have an isse assigning values to each segment:

Check my attached app to look for differences.
- Mark as New
- Bookmark
- Subscribe
- Mute
- Subscribe to RSS Feed
- Permalink
- Report Inappropriate Content
That looks like an issue on the way accumulations are calculated, in this case I would suggest to create data so all combinations on Entry and month has data, this script assigns zero to the non-existant combinations:
Data:
NoConcatenate
LOAD Entry, Data, Dual(Month, NumMonth) as Month, Entry &'_'& Month as KeyLoaded;
LOAD *, Num(Month(Date#(Month, 'MMM'))) as NumMonth Resident Blad1 where Data<>0; // This 'where' is just to simulate the null value on Jul

DROP Table Blad1;

// Generate all possible combinations between Entry and Month
Cartesian:
LOAD FieldValue('Entry', RecNo()) as Entry AutoGenerate FieldValueCount('Entry');
Join LOAD FieldValue('Month', RecNo()) as Month,
	Num(Month(Date#(FieldValue('Month', RecNo()), 'MMM'))) as NumMonth
AutoGenerate FieldValueCount('Month');

// Add to loaded data those that doesn't exists
Concatenate (Data)
LOAD Entry, 0 as Data, Dual(Month, NumMonth) as Month
Resident Cartesian where not exists('KeyLoaded', Entry &'_'& Month);

DROP table Cartesian;
DROP Field KeyLoaded;
- Mark as New
- Bookmark
- Subscribe
- Mute
- Subscribe to RSS Feed
- Permalink
- Report Inappropriate Content
Hi, february-2020 version has an option to apply modifiers, one of them is accumulation.
Using 2 stacked dimensions and a expression the expression it generates automatically is:
Sum({1<[$(=Replace(GetObjectField(0),']',']]'))]={">=$(=Min([$(=Replace(GetObjectField(0),']',']]'))]))<=$(=Max([$(=Replace(GetObjectField(0),']',']]'))]))"},[$(=Replace(GetObjectField(1),']',']]'))]={"=Only({1}[$(=Replace(GetObjectField(1),']',']]'))])>='$(=MinString([$(=Replace(GetObjectField(1),']',']]'))]))' and Only({1}[$(=Replace(GetObjectField(1),']',']]'))])<='$(=MaxString([$(=Replace(GetObjectField(1),']',']]'))]))'"}>}Aggr(RangeSum(Above(If(Count([$(=Replace(GetObjectField(0),']',']]'))]) * Count([$(=Replace(GetObjectField(1),']',']]'))]) > 0, ( Sum(Val) ) + Sum({1<[$(=Replace(GetObjectField(0),']',']]'))]={">=$(=Min([$(=Replace(GetObjectField(0),']',']]'))]))<=$(=Max([$(=Replace(GetObjectField(0),']',']]'))]))"},[$(=Replace(GetObjectField(1),']',']]'))]={"=Only({1}[$(=Replace(GetObjectField(1),']',']]'))])>='$(=MinString([$(=Replace(GetObjectField(1),']',']]'))]))' and Only({1}[$(=Replace(GetObjectField(1),']',']]'))])<='$(=MaxString([$(=Replace(GetObjectField(1),']',']]'))]))'"}>}0), 0), 0, RowNo())), ([$(=Replace(GetObjectField(1),']',']]'))], (Numeric, Ascending), (Text, Ascending)), ([$(=Replace(GetObjectField(0),']',']]'))], (Numeric, Ascending), (Text, Ascending))))

- Mark as New
- Bookmark
- Subscribe
- Mute
- Subscribe to RSS Feed
- Permalink
- Report Inappropriate Content
Ok, so I just have to wait for my IT department to update to the february 2020 release which is now planned on April 23. Sounds great! Thanks Rubenmarin, I´ll accept as solution as soon as it´s available and works for us.
- Mark as New
- Bookmark
- Subscribe
- Mute
- Subscribe to RSS Feed
- Permalink
- Report Inappropriate Content
Meanwhile you can use the expression it creates automatically. I haven't tested in previous versions but it may work.
- Mark as New
- Bookmark
- Subscribe
- Mute
- Subscribe to RSS Feed
- Permalink
- Report Inappropriate Content
Finally we got the Feb release installed and I tried the new functionality. Didn´t get it to work properly though??? I attached some data and images. In these you can see that the size of the different stacks are wrong and the scale on the Y axis is wrong. When I hover over the stacks in the bars, the popup presents correct values.
- Mark as New
- Bookmark
- Subscribe
- Mute
- Subscribe to RSS Feed
- Permalink
- Report Inappropriate Content
Hello,
Can u tell me what dimensions and measures u want on X axis and Y axis.
Regards,
Shivani Sapkale
- Mark as New
- Bookmark
- Subscribe
- Mute
- Subscribe to RSS Feed
- Permalink
- Report Inappropriate Content
I want the months on the X axis, and the data (values) on the Y axis. Bars should be split as a stacked bar chart, with each stack displaying the accumulated sum of the Entry field.
- Mark as New
- Bookmark
- Subscribe
- Mute
- Subscribe to RSS Feed
- Permalink
- Report Inappropriate Content
Mine seems correct, and in your screenshot E has 400k, wich is correct with his Y axis, maybe you have an isse assigning values to each segment:
Check my attached app to look for differences.
- Mark as New
- Bookmark
- Subscribe
- Mute
- Subscribe to RSS Feed
- Permalink
- Report Inappropriate Content
Fantastic! Thank´s. This part was what was missing in my app
Data:
NoConcatenate
LOAD Entry, Data, Dual(Month, NumMonth) as Month;
LOAD *, Num(Month(Date#(Month, 'MMM'))) as NumMonth Resident Blad1;
DROP Table Blad1;
- Mark as New
- Bookmark
- Subscribe
- Mute
- Subscribe to RSS Feed
- Permalink
- Report Inappropriate Content
If there is a null() value in the data, then the accumulation is interrupted (see July). Any suggestion how to solve that?
- « Previous Replies
-
- 1
- 2
- Next Replies »