Unlock a world of possibilities! Login now and discover the exclusive benefits awaiting you.
- Qlik Community
- :
- Forums
- :
- Analytics & AI
- :
- Products & Topics
- :
- Visualization and Usability
- :
- Subset Ratio
- Subscribe to RSS Feed
- Mark Topic as New
- Mark Topic as Read
- Float this Topic for Current User
- Bookmark
- Subscribe
- Mute
- Printer Friendly Page
- Mark as New
- Bookmark
- Subscribe
- Mute
- Subscribe to RSS Feed
- Permalink
- Report Inappropriate Content
Subset Ratio
I have requirement to show subset ratio the one we get in data model into front end as a KPI or in nay form.
Thanks in advance
- « Previous Replies
-
- 1
- 2
- Next Replies »
Accepted Solutions
- Mark as New
- Bookmark
- Subscribe
- Mute
- Subscribe to RSS Feed
- Permalink
- Report Inappropriate Content
Hi,
- Subset ratio (only on key) shows the percentage of all distinct values for a field in the table compared to all the distinct values for that field in the entire data model.
So you can easily calculate it by using a flag in every table that you want to check.
For example you have 2 table loaded in your app as below:
Table1:
Load * INLINE [
 KEY, Value, FlagTable1
    A, 1, 1
    B, 2, 1
    C, 4, 1
    D, 10, 1
    D, 5, 1
];


Table2:
Load * INLINE [
 KEY, NewValue, FlagTable2
    A, x, 1
    B, y, 1
    E, z, 1
];
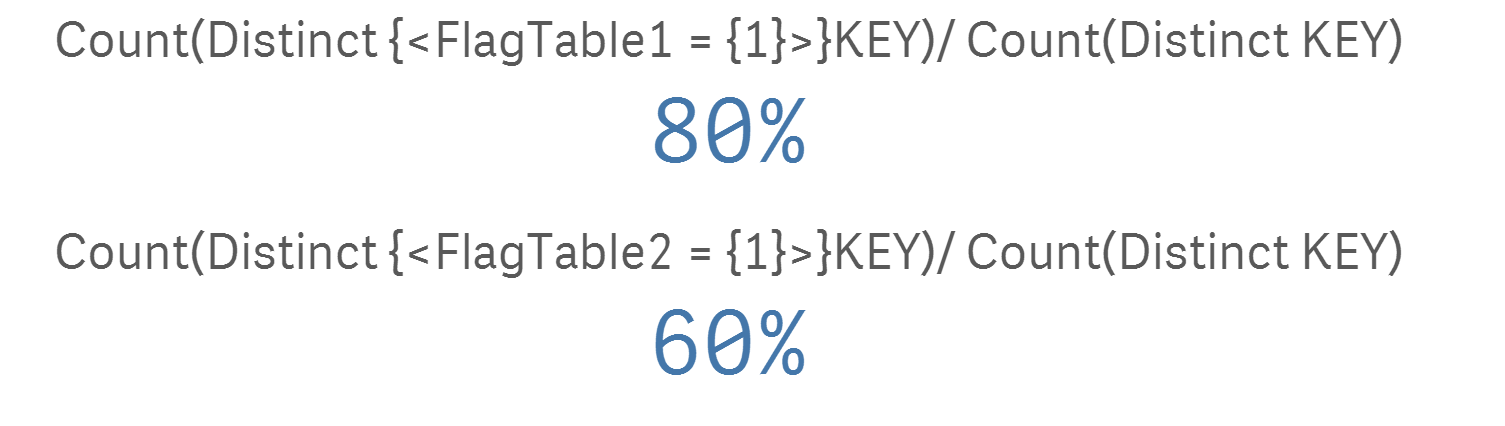
In the data model view, you can find the subset ratio of the KEY in table 1 and table 2 (80% for table1 and 60% for table2).
Then you just visualize it by KPI, text...like this:
- Mark as New
- Bookmark
- Subscribe
- Mute
- Subscribe to RSS Feed
- Permalink
- Report Inappropriate Content
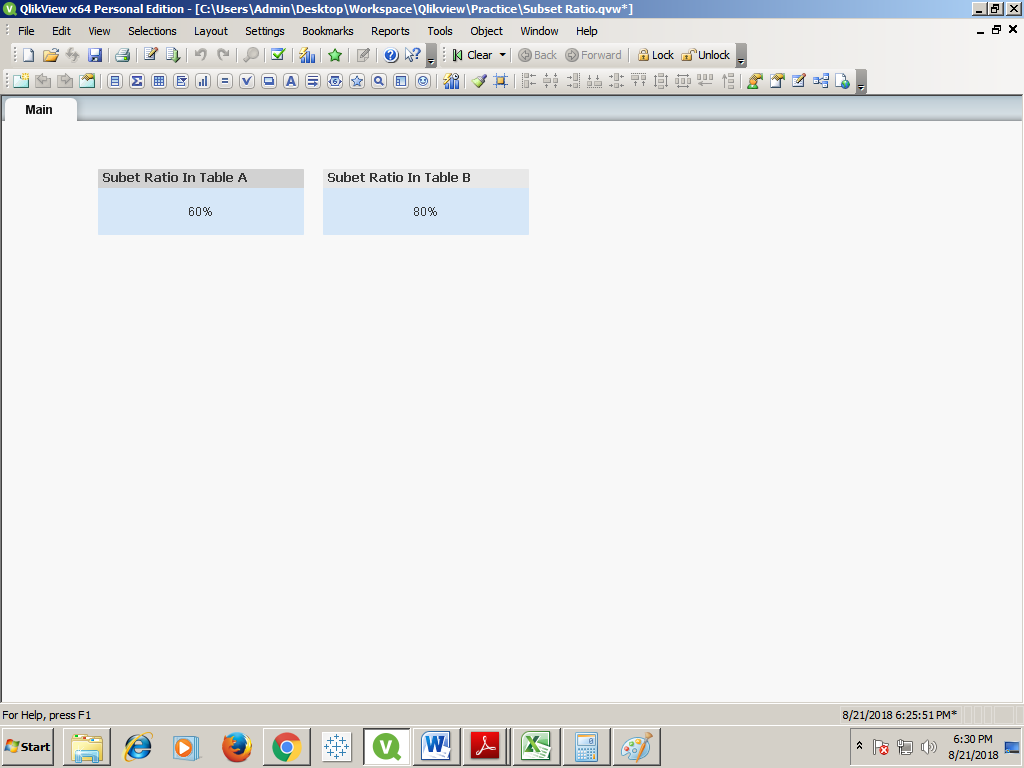
Suppose there are five unique occurrences in the field Id (numbers 1-5). The subset ratio in table A is 60% (3/5, ie 3 unique occurrences as compared to 4 rows in the table). In table B the subset ratio will be 80% (numbers 1, 2, 4 and 5 as compared to the total the numbers 1-5, ie 4/5).
A:
LOAD * INLINE [
Id, name
1, A
2, B
3, C
3, Cbis
];
B:
LOAD * INLINE [
Id, Class
1, I
2, II
4, IV
5, V
];
So The subset Ratio For Table A is 60% and For Table B is 80%
To display this subset ratio in Front end use text box
1) To display Subset ratio For Table A Create a text box and specify the condition as =(3/5)*100&'%'&
2) To display Subset ratio For Table B Create a text box and specify the condition as =(4/5)*100&'%'&
Finally give the name to both the textboxes you will get the following output as shown in the image
- Mark as New
- Bookmark
- Subscribe
- Mute
- Subscribe to RSS Feed
- Permalink
- Report Inappropriate Content
Your question is not clear. I don't understand what you want.
But when you want to make a data with custom view, try to use Mashup:
This is a HTML page that uses data reference in Qlik Sense. It is easy to work with and the platform inside Qlik Sense is very intuitive.
Thanks,
Like, Mark as helpful and Mark as the answer if it is. That helps a lot!
Qlik On!
- Mark as New
- Bookmark
- Subscribe
- Mute
- Subscribe to RSS Feed
- Permalink
- Report Inappropriate Content
Hello Felipe,
I basically want to show subset ration in visulisation
so subset ration percentage of rows that contain a distinct value for a field.
- Mark as New
- Bookmark
- Subscribe
- Mute
- Subscribe to RSS Feed
- Permalink
- Report Inappropriate Content
Hello Felipe,
I basically want to show subset ratio in visualization
so subset ration percentage of rows that contain a distinct value for a field and we can see this % buy clicking data model and then click on field name.
can u show the value coming in subset ration in a form of chart
- Mark as New
- Bookmark
- Subscribe
- Mute
- Subscribe to RSS Feed
- Permalink
- Report Inappropriate Content
So, Like this?
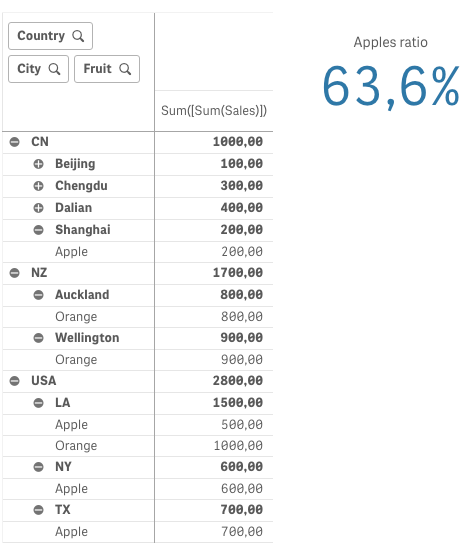
This ratio is achieved this way:
=count({<Fruit={'Apple'}>}Fruit)/count(Fruit)
Count will count all itens from that field.
{<Fruit={'Apple'}>} this is a independent filter that will work even if the filter tab is clean.
So it will count all apples and divide by all fruits, giving me the ratio.
Is that what you want?
- Mark as New
- Bookmark
- Subscribe
- Mute
- Subscribe to RSS Feed
- Permalink
- Report Inappropriate Content
Hi,
- Subset ratio (only on key) shows the percentage of all distinct values for a field in the table compared to all the distinct values for that field in the entire data model.
So you can easily calculate it by using a flag in every table that you want to check.
For example you have 2 table loaded in your app as below:
Table1:
Load * INLINE [
 KEY, Value, FlagTable1
    A, 1, 1
    B, 2, 1
    C, 4, 1
    D, 10, 1
    D, 5, 1
];


Table2:
Load * INLINE [
 KEY, NewValue, FlagTable2
    A, x, 1
    B, y, 1
    E, z, 1
];
In the data model view, you can find the subset ratio of the KEY in table 1 and table 2 (80% for table1 and 60% for table2).
Then you just visualize it by KPI, text...like this:
- Mark as New
- Bookmark
- Subscribe
- Mute
- Subscribe to RSS Feed
- Permalink
- Report Inappropriate Content
Thanks this is what I am looking for also is it possible to show this in form of Sankey chart where table name as dimensions and then I can show %flow with other table.
I hope I am making sense to you.
actually we have two different systems and we have build a meet /match table now I want to show to higher management about subset ration btw these three
- Mark as New
- Bookmark
- Subscribe
- Mute
- Subscribe to RSS Feed
- Permalink
- Report Inappropriate Content
Create a duplicate column in datamodel with different name for column who's subset ratio is to be shown.
Count(Distinct Newcolumnname)/Count(Distinct Columnname)
This can be used in front end to find subset ratio
- Mark as New
- Bookmark
- Subscribe
- Mute
- Subscribe to RSS Feed
- Permalink
- Report Inappropriate Content
yes I am doing this for time being but I have to show data flow across tables in form of some chart like Sankey chart.
- « Previous Replies
-
- 1
- 2
- Next Replies »