Unlock a world of possibilities! Login now and discover the exclusive benefits awaiting you.
Announcements
Now accepting applications for the Qlik Luminary and Partner Ambassador Programs: Apply by July 6!
- Qlik Community
- :
- Forums
- :
- Analytics & AI
- :
- Products & Topics
- :
- Visualization and Usability
- :
- Switching between graphs in sense
Options
- Subscribe to RSS Feed
- Mark Topic as New
- Mark Topic as Read
- Float this Topic for Current User
- Bookmark
- Subscribe
- Mute
- Printer Friendly Page
Turn on suggestions
Auto-suggest helps you quickly narrow down your search results by suggesting possible matches as you type.
Showing results for
Creator
2017-07-12
05:42 AM
- Mark as New
- Bookmark
- Subscribe
- Mute
- Subscribe to RSS Feed
- Permalink
- Report Inappropriate Content
Switching between graphs in sense
Hi!
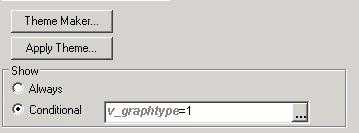
In QlikView i can swithe between different graphs (each one with different KPI's) on the same sheet.
Each graph has a different variable value. E.g. v_graphtype=1, v_graphtype=2, etc
This is found under Chart Properties -> Layout in View.
I use buttons to to set the 'v_graphtype' to different values and this will present different graphs with different KPI's.
How can this be done in Sense?
755 Views
2 Replies
Partner - Creator III
2017-07-12
05:49 AM
- Mark as New
- Bookmark
- Subscribe
- Mute
- Subscribe to RSS Feed
- Permalink
- Report Inappropriate Content
Hi, you can do something similar with Variable Toggle which can be download from Branch.
Daniel
717 Views
Creator
2017-07-12
05:54 AM
Author
- Mark as New
- Bookmark
- Subscribe
- Mute
- Subscribe to RSS Feed
- Permalink
- Report Inappropriate Content
Hi!
Yes I know.
But how to switch between different graphs depending on the variable value?
/Stefan
717 Views