Unlock a world of possibilities! Login now and discover the exclusive benefits awaiting you.
- Qlik Community
- :
- Forums
- :
- Analytics & AI
- :
- Products & Topics
- :
- Visualization and Usability
- :
- Re: Table/Chart with multiple Dimensions and Expre...
- Subscribe to RSS Feed
- Mark Topic as New
- Mark Topic as Read
- Float this Topic for Current User
- Bookmark
- Subscribe
- Mute
- Printer Friendly Page
- Mark as New
- Bookmark
- Subscribe
- Mute
- Subscribe to RSS Feed
- Permalink
- Report Inappropriate Content
Table/Chart with multiple Dimensions and Expressions
Hello Folks,
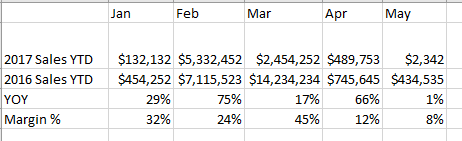
In Qlikview, I can have a table/chart with multiple rows, and each row is a different dimension. And then a different expression is calculated for each row. I have a mockup below. Whereby the expressions used are all different, ranging from Sum(Sales) to Sum({Year})/Sum({Year-1}).
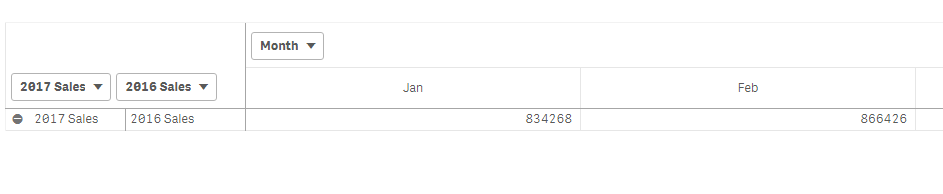
As of now, the only thing I've been able to get done that looks like this in QlikSense is the following.
Is there anway I can accomplish my goal?
Any help is greatly appreciated.
- Mark as New
- Bookmark
- Subscribe
- Mute
- Subscribe to RSS Feed
- Permalink
- Report Inappropriate Content
May be like this
2017
Sum({<Year = {$(=Max(Year))}>} Sales)
2016
Sum({<Year = {$(=Max(Year)-1)}>} Sales)
YoY
Sum({<Year = {$(=Max(Year))}>} Sales)/Sum({<Year = {$(=Max(Year)-1)}>} Sales) - 1
- Mark as New
- Bookmark
- Subscribe
- Mute
- Subscribe to RSS Feed
- Permalink
- Report Inappropriate Content
I'm not having a problem with the calculation, I'm having an issue of where the calculation should go in the UI component.
- Mark as New
- Bookmark
- Subscribe
- Mute
- Subscribe to RSS Feed
- Permalink
- Report Inappropriate Content
As a measure in your table object or are you looking for something else?
- Mark as New
- Bookmark
- Subscribe
- Mute
- Subscribe to RSS Feed
- Permalink
- Report Inappropriate Content
As a dimension choose:
ValueList('2017 Sales YTD', '2016 Sales YTD','YOY','Margin')
as a measure:
if(ValueList('2017 Sales YTD', '2016 Sales YTD','YOY','Margin')='2017 Sales YTD', expression for YTD 2017,
if(ValueList('2017 Sales YTD', '2016 Sales YTD','YOY','Margin')='2016 Sales YTD', expression for YTD 2016,
if(ValueList('2017 Sales YTD', '2016 Sales YTD','YOY','Margin')='YOY', expression for YOY,
if(ValueList('2017 Sales YTD', '2016 Sales YTD','YOY','Margin')='Margin', expression for Margin))))
then add as a column: Your month field:
You'll have the output you're looking for