Unlock a world of possibilities! Login now and discover the exclusive benefits awaiting you.

- Qlik Community
- :
- Forums
- :
- Analytics & AI
- :
- Products & Topics
- :
- Visualization and Usability
- :
- Time Series Line Chart
- Subscribe to RSS Feed
- Mark Topic as New
- Mark Topic as Read
- Float this Topic for Current User
- Bookmark
- Subscribe
- Mute
- Printer Friendly Page

- Mark as New
- Bookmark
- Subscribe
- Mute
- Subscribe to RSS Feed
- Permalink
- Report Inappropriate Content
Time Series Line Chart
I'm trying to make a line chart that displays dates on the x-axis and amount on the y-axis
| Date | Name | Amount |
| 1/1/2017 | ABC | 100 |
| 1/15/2017 | ABC | 200 |
| 1/10/2017 | XYZ | 3000 |
| 1/20/2017 | XYZ | 4000 |
I've attached a file to show what I would like to achieve. Any help would be appreciated. Thanks!

 OmarBenSalem
- Mark as New
- Bookmark
- Subscribe
- Mute
- Subscribe to RSS Feed
- Permalink
- Report Inappropriate Content
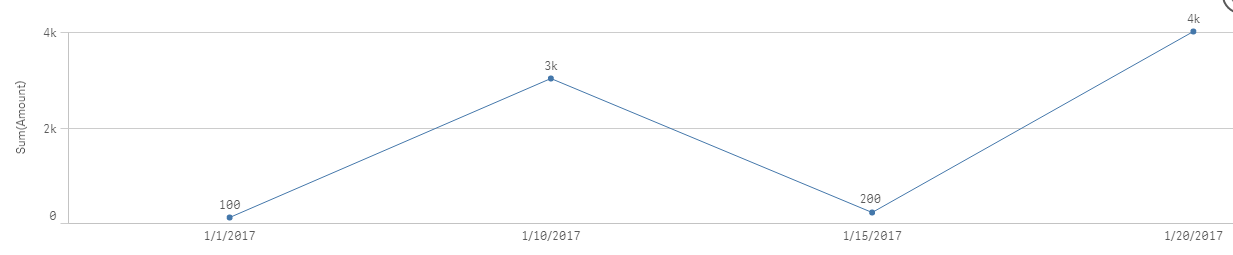
drag a line chart:
as dimension : Date
as measure: sum(Amount)
Under aspect, x-axis, make the axis not continued
- Mark as New
- Bookmark
- Subscribe
- Mute
- Subscribe to RSS Feed
- Permalink
- Report Inappropriate Content
Hi Omar,
Thank you for the quick response, but that doesn't really get me what I need. I need the line to only go up or down on that specific date vs a gradual increase and decrease.
OmarBenSalem
- Mark as New
- Bookmark
- Subscribe
- Mute
- Subscribe to RSS Feed
- Permalink
- Report Inappropriate Content
That won't do it?
- Mark as New
- Bookmark
- Subscribe
- Mute
- Subscribe to RSS Feed
- Permalink
- Report Inappropriate Content
I have same question. And I want to how I can create 2 different charts with 2 different names, plus how to create 2 lines at the same chart ( with 2 different names ) ? Thank you!