Unlock a world of possibilities! Login now and discover the exclusive benefits awaiting you.

- Qlik Community
- :
- Forums
- :
- Analytics & AI
- :
- Products & Topics
- :
- Visualization and Usability
- :
- Time aware graph continuous scale issues
- Subscribe to RSS Feed
- Mark Topic as New
- Mark Topic as Read
- Float this Topic for Current User
- Bookmark
- Subscribe
- Mute
- Printer Friendly Page

- Mark as New
- Bookmark
- Subscribe
- Mute
- Subscribe to RSS Feed
- Permalink
- Report Inappropriate Content
Time aware graph continuous scale issues
Hi Qlik,
I'm very keen to use the new time aware graph as a problem I've been having is data over long time periods become unmanagable.
However when displaying the data Qlik seems to only pick certain values producing a less than ideal time line.
I'm new to this visual and hoping I'be just missed something obvious. See below:
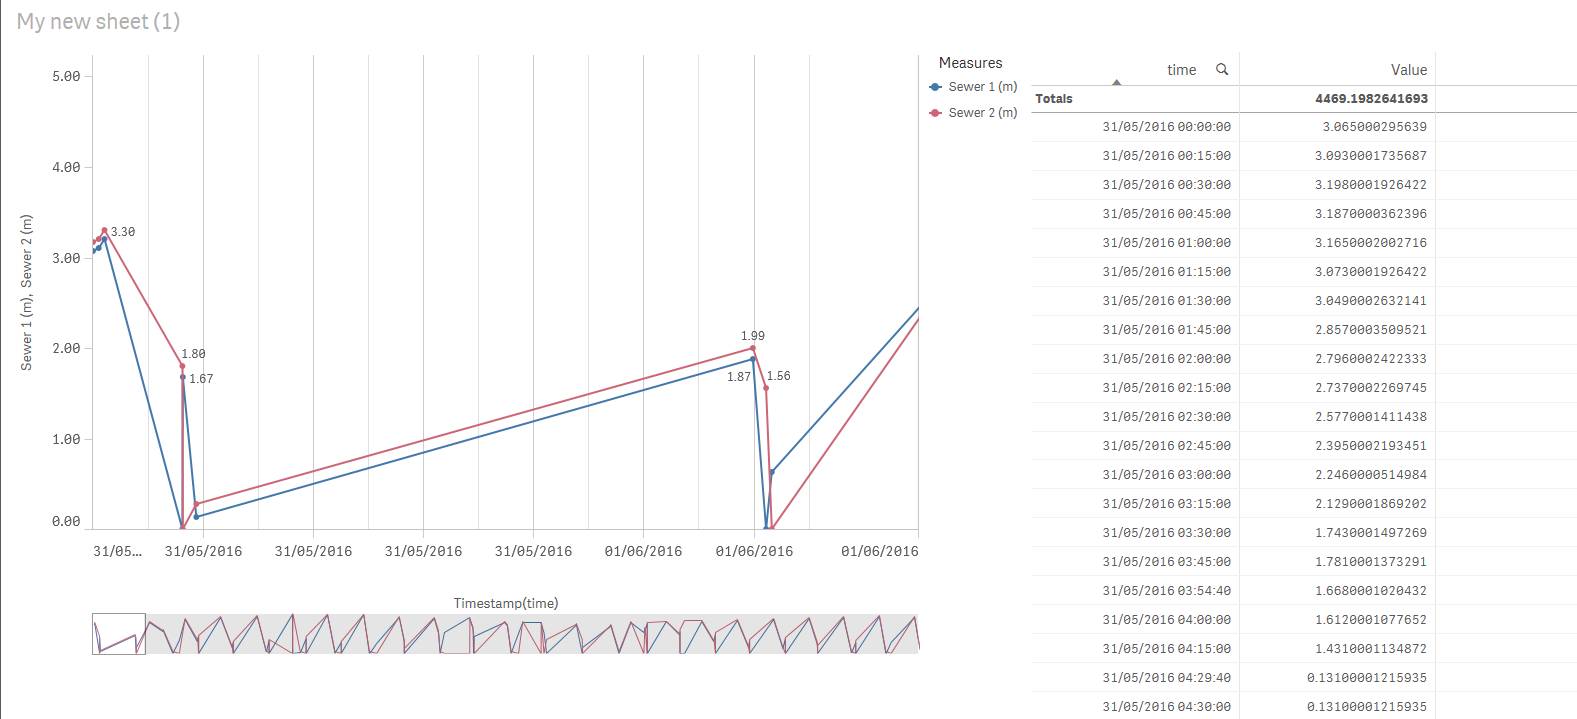
The table to the left shows the data going in (a simple sum(value) against a data/time value.
Zooming in on the line graph shows the graph being broken down from month to date to hour etc so it is reading [time] as a time function, just missing huge chunks. Switching from continuous give the shape I would like to show (but without the zoom functions.
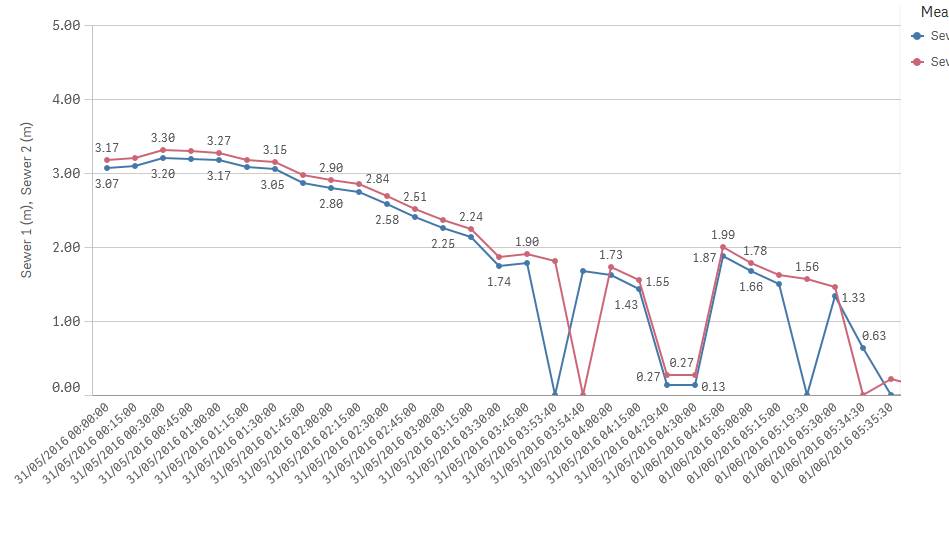
vs
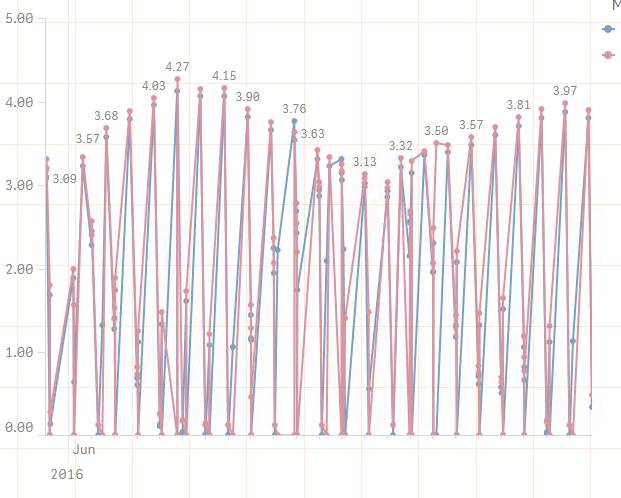
Any help would be appreciated,
Regards,
Chris