Unlock a world of possibilities! Login now and discover the exclusive benefits awaiting you.

- Qlik Community
- :
- Forums
- :
- Analytics & AI
- :
- Products & Topics
- :
- Visualization and Usability
- :
- To colour a bar in chart with multiple colours
- Subscribe to RSS Feed
- Mark Topic as New
- Mark Topic as Read
- Float this Topic for Current User
- Bookmark
- Subscribe
- Mute
- Printer Friendly Page

 Beginner_Qlik1
- Mark as New
- Bookmark
- Subscribe
- Mute
- Subscribe to RSS Feed
- Permalink
- Report Inappropriate Content
To colour a bar in chart with multiple colours
Hi,
I have to colour the bars of chart in colour Green (for consumption less than 850)and the rest of colour of same bar in red (for consumption more than 850).
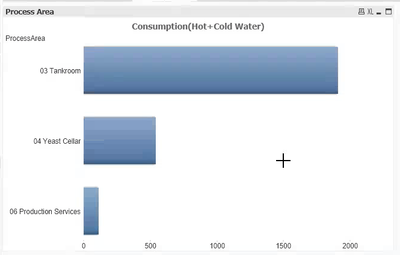
So for "03 Tankroom" , bar should be both in green(for <=850) and red(1911-850) color. and other two bars should be in Green color.
Could some one let me know how to achieve this?
Thanks in advance
Accepted Solutions
 rodrigo_martins
- Mark as New
- Bookmark
- Subscribe
- Mute
- Subscribe to RSS Feed
- Permalink
- Report Inappropriate Content
Just create two expressions in your graph (assuming Sum(Value) is your expression):
if(Sum(Value) <= 850, Sum(Value), 850)
and
if(Sum(Value) > 850, Sum(Value) - 850, 0)
Additionally, you must select the option for stacked display, on Style Tab, Stacked Subtype.
Then, simply define a color for each expression in the Colors tab.

rodrigo_martins
- Mark as New
- Bookmark
- Subscribe
- Mute
- Subscribe to RSS Feed
- Permalink
- Report Inappropriate Content
Just create two expressions in your graph (assuming Sum(Value) is your expression):
if(Sum(Value) <= 850, Sum(Value), 850)
and
if(Sum(Value) > 850, Sum(Value) - 850, 0)
Additionally, you must select the option for stacked display, on Style Tab, Stacked Subtype.
Then, simply define a color for each expression in the Colors tab.
Beginner_Qlik1
- Mark as New
- Bookmark
- Subscribe
- Mute
- Subscribe to RSS Feed
- Permalink
- Report Inappropriate Content
Thanks a lot Rodrigo!
It worked
Beginner_Qlik1
- Mark as New
- Bookmark
- Subscribe
- Mute
- Subscribe to RSS Feed
- Permalink
- Report Inappropriate Content
Hi Rodrigo,
How can I show the limit of field "Value" (here it is 850) in green part of the bar? I tried option "Value on data points" in the "Expression" tab. But it is not working.
Thanks in advance
