Unlock a world of possibilities! Login now and discover the exclusive benefits awaiting you.
- Qlik Community
- :
- Forums
- :
- Analytics & AI
- :
- Products & Topics
- :
- Visualization and Usability
- :
- Top 100 customers ranked by 2 or more measures
- Subscribe to RSS Feed
- Mark Topic as New
- Mark Topic as Read
- Float this Topic for Current User
- Bookmark
- Subscribe
- Mute
- Printer Friendly Page
- Mark as New
- Bookmark
- Subscribe
- Mute
- Subscribe to RSS Feed
- Permalink
- Report Inappropriate Content
Top 100 customers ranked by 2 or more measures
Hi All,
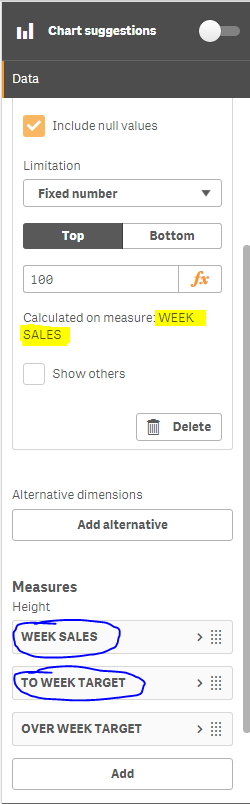
I would like to display only the top 100 customers in a chart based on the sum of two of my measures (circled in blue in attachment).
Please help.
- Mark as New
- Bookmark
- Subscribe
- Mute
- Subscribe to RSS Feed
- Permalink
- Report Inappropriate Content
- Mark as New
- Bookmark
- Subscribe
- Mute
- Subscribe to RSS Feed
- Permalink
- Report Inappropriate Content
Is there a way to add another measure, but not display it in the graph? I have attached a picture of what the graph currently looks like so you can see why the split between the 3 measures is needed.
- Mark as New
- Bookmark
- Subscribe
- Mute
- Subscribe to RSS Feed
- Permalink
- Report Inappropriate Content
Hi Henk
I am replying to your original question. You can try something like this for your dimension:
=Aggr(ONLY({<[Dimension] = {'=Rank([Measure 1] + [Measure 2])<=100'}>} [Dimension]),[Dimension])
You can just replace [Dimension], [Measure 1] and [Measure 2] with your original dimension (for example Client) and two measure formulas (for example Sum(Sales) and Sum (Outstanding Sales)).
Hope this helps.
Regards,
Mauritz