Unlock a world of possibilities! Login now and discover the exclusive benefits awaiting you.
- Qlik Community
- :
- Forums
- :
- Analytics & AI
- :
- Products & Topics
- :
- Visualization and Usability
- :
- Re: Top N Filter Pane
- Subscribe to RSS Feed
- Mark Topic as New
- Mark Topic as Read
- Float this Topic for Current User
- Bookmark
- Subscribe
- Mute
- Printer Friendly Page
- Mark as New
- Bookmark
- Subscribe
- Mute
- Subscribe to RSS Feed
- Permalink
- Report Inappropriate Content
Top N Filter Pane
Hello All,
I have a Customer data sheet and i have various charts showing the customer purchases and so on.. I want to have a filter 'Top n' customers so that the user will chose the number n (5,10,15,20..) and see the visualizations accordingly. Let say in the below example, I want to see a filter pane of Top 2,3,4 Customers.
| Top n Customers |
|---|
| 2 |
| 3 |
| 4 |
| Customer | Purchase |
|---|---|
A | salt |
| A | tea |
| B | coffee |
| C | fruits |
| D | salt |
| A | tea |
| B | coffee |
| B | fruits |
| C | salt |
| E | tea |
Regards
Accepted Solutions
- Mark as New
- Bookmark
- Subscribe
- Mute
- Subscribe to RSS Feed
- Permalink
- Report Inappropriate Content
Hi Prateek,
You can achive this easily by using qsVariable extension Qlik Branch
- First you need to define a variable like 'vTopN' and give a default value like 5.
- Add the extension and give name same as your variable.
- Add alternative values to variable like 5,10,20,All
- On chart, go to dimension property,change limitation to 'Fixed Value' and put $(vTopN) in the expression field.
Note : For All option in variable, you should write an expression like count(total customer)
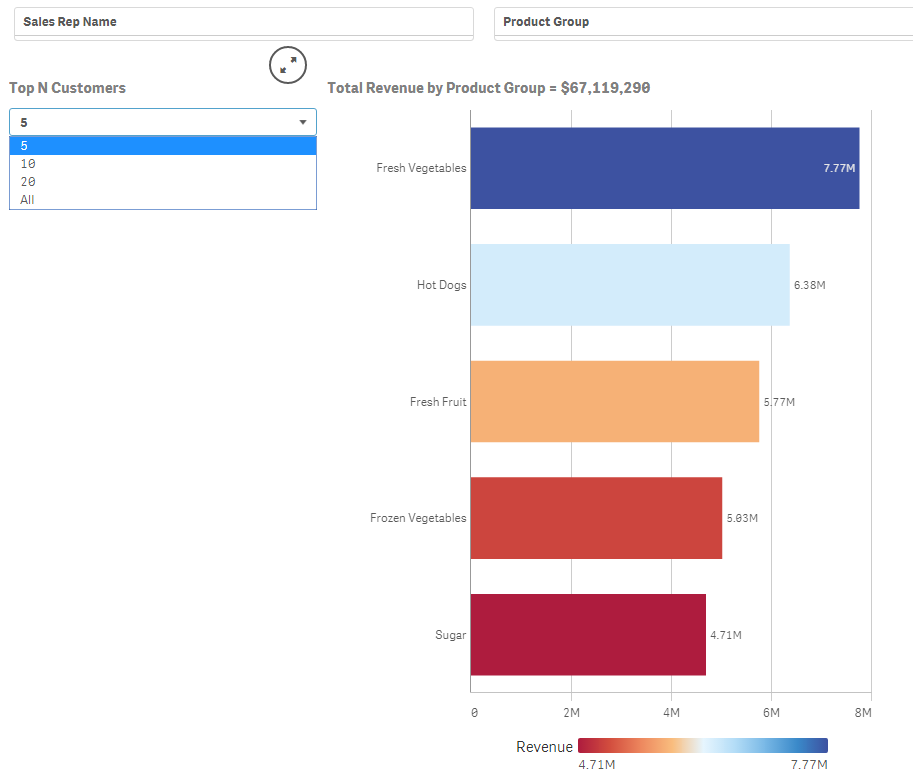
I added a sample app, you can look at the 'Sales Analysis' sheet.
Hope it will help.
- Mark as New
- Bookmark
- Subscribe
- Mute
- Subscribe to RSS Feed
- Permalink
- Report Inappropriate Content
Hi Prateek,
You can achive this easily by using qsVariable extension Qlik Branch
- First you need to define a variable like 'vTopN' and give a default value like 5.
- Add the extension and give name same as your variable.
- Add alternative values to variable like 5,10,20,All
- On chart, go to dimension property,change limitation to 'Fixed Value' and put $(vTopN) in the expression field.
Note : For All option in variable, you should write an expression like count(total customer)
I added a sample app, you can look at the 'Sales Analysis' sheet.
Hope it will help.
- Mark as New
- Bookmark
- Subscribe
- Mute
- Subscribe to RSS Feed
- Permalink
- Report Inappropriate Content
Hi Prateek,
First create a temporary table with alternate values, and load the table values in the filter pane.
Map / link with the main table.
Regards,
Rajesh R. S,
- Mark as New
- Bookmark
- Subscribe
- Mute
- Subscribe to RSS Feed
- Permalink
- Report Inappropriate Content
Thanks a lot kaan 
- Mark as New
- Bookmark
- Subscribe
- Mute
- Subscribe to RSS Feed
- Permalink
- Report Inappropriate Content
Hi Kaanerisen, I have question on your step 3: Add alternative values to variable like 5,10,20,All
Could you please advise more details on how to add alternative values? thanks!