Unlock a world of possibilities! Login now and discover the exclusive benefits awaiting you.

- Qlik Community
- :
- Forums
- :
- Analytics & AI
- :
- Products & Topics
- :
- Visualization and Usability
- :
- Two dimension chart
- Subscribe to RSS Feed
- Mark Topic as New
- Mark Topic as Read
- Float this Topic for Current User
- Bookmark
- Subscribe
- Mute
- Printer Friendly Page

 janvomgcz
- Mark as New
- Bookmark
- Subscribe
- Mute
- Subscribe to RSS Feed
- Permalink
- Report Inappropriate Content
Two dimension chart
Hi everyone,
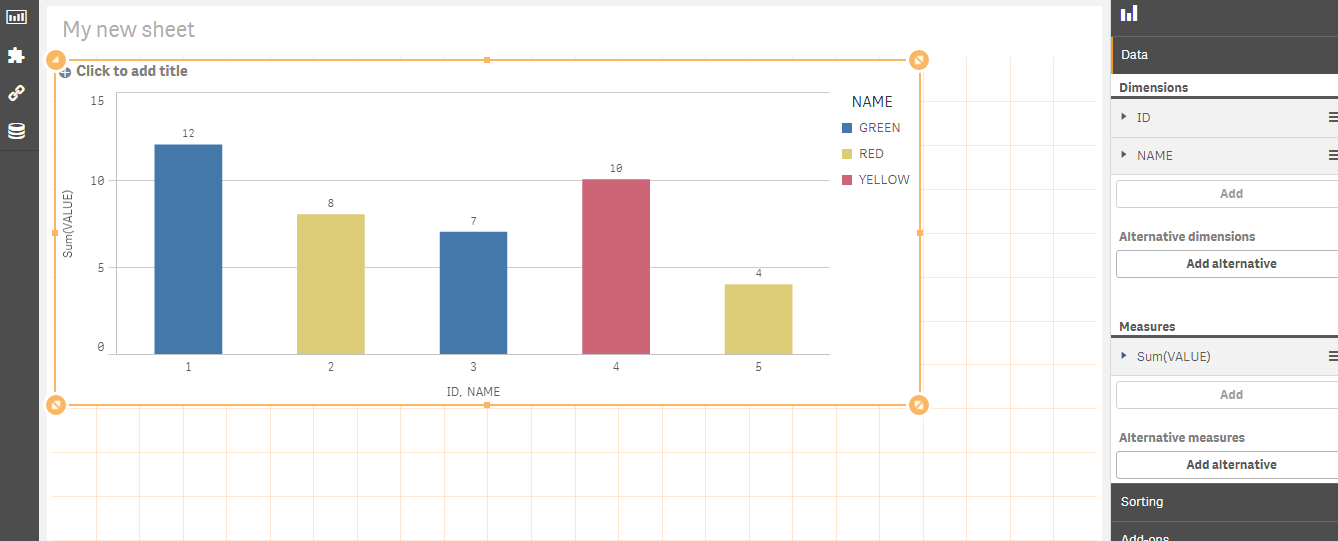
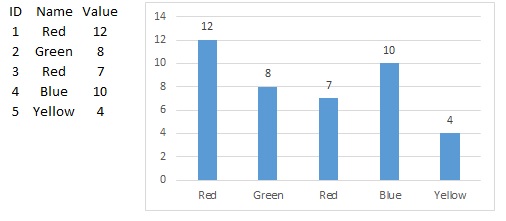
I am trying to create a bar chart from two dimension dataset but showing one dimension only.
Is this somehow achievable?
I am quite new to Qlik Sense, any help would be much appreciated.

 agigliotti
- Mark as New
- Bookmark
- Subscribe
- Mute
- Subscribe to RSS Feed
- Permalink
- Report Inappropriate Content
yes of course, set Dimension = Name and measure = Sum(Value).
Follow me on my LinkedIn | Know Gamma Informatica at gammainformatica.it
janvomgcz
- Mark as New
- Bookmark
- Subscribe
- Mute
- Subscribe to RSS Feed
- Permalink
- Report Inappropriate Content
Thanks,
But that would group values in Name field together (Red)? I also really need to distinct the ID.

 theglenndavid
- Mark as New
- Bookmark
- Subscribe
- Mute
- Subscribe to RSS Feed
- Permalink
- Report Inappropriate Content
You can add a secondary dimension (ID) on the bar chart. Depending on how you want to view the data, you can leave it grouped or stack them on the primary dimension.
janvomgcz
- Mark as New
- Bookmark
- Subscribe
- Mute
- Subscribe to RSS Feed
- Permalink
- Report Inappropriate Content
I would like to view the data exactly as shown in the enclosed example chart.
Something like Dimension=Name and Measure=Sum("Distinct ID" Value) so
it would somehow show "Red" twice in a chart with different values (12 and 7).
Is this even possible?
agigliotti
- Mark as New
- Bookmark
- Subscribe
- Mute
- Subscribe to RSS Feed
- Permalink
- Report Inappropriate Content
Try using:
Dimension = (ID & Name) and Measure = Sum(Value).
Follow me on my LinkedIn | Know Gamma Informatica at gammainformatica.it

 sumanta12
- Mark as New
- Bookmark
- Subscribe
- Mute
- Subscribe to RSS Feed
- Permalink
- Report Inappropriate Content