Unlock a world of possibilities! Login now and discover the exclusive benefits awaiting you.

- Qlik Community
- :
- Forums
- :
- Analytics & AI
- :
- Products & Topics
- :
- Visualization and Usability
- :
- Unique period in graph
Options
- Subscribe to RSS Feed
- Mark Topic as New
- Mark Topic as Read
- Float this Topic for Current User
- Bookmark
- Subscribe
- Mute
- Printer Friendly Page
Turn on suggestions
Auto-suggest helps you quickly narrow down your search results by suggesting possible matches as you type.
Showing results for

 Bart_Breekveldt
Contributor III
2019-06-06
09:32 AM
- Mark as New
- Bookmark
- Subscribe
- Mute
- Subscribe to RSS Feed
- Permalink
- Report Inappropriate Content
Unique period in graph
Dear community,
I've set up a custom time period (4 weeks). Our company works with periods instead of months. My script is as follows:
=Dual('P'&Num((Week([Order.Leverdatum])+1)/4,00),Num((Week([Order.Leverdatum])+1)/4,00))
(Order.leverdatum (Dutch) translates to order.delivery_date)
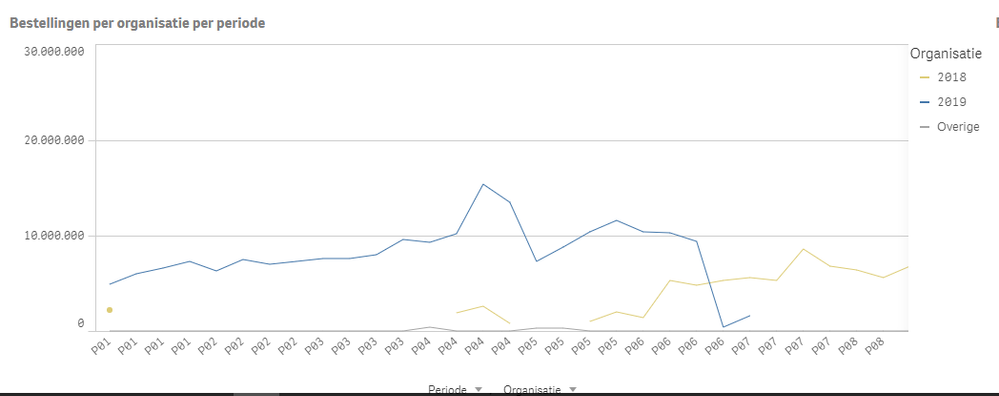
However in a graph it looks like this (see below). When selecting "period" I get the same graph as when I select week. The period shows up four times and are aggregated as weeks.
I've tried GROUP BY, AGGR and DISTINCT funtions, but it didn't help. What am I doing wrong?
How can I aggregate these period, so my graph show the orders per period?
Thanks in advance

- Tags:
- dates
652 Views
0 Replies
