Unlock a world of possibilities! Login now and discover the exclusive benefits awaiting you.

- Qlik Community
- :
- Forums
- :
- Analytics & AI
- :
- Products & Topics
- :
- Visualization and Usability
- :
- Use Rangesum to make Stacked bar chart with catego...
Options
- Subscribe to RSS Feed
- Mark Topic as New
- Mark Topic as Read
- Float this Topic for Current User
- Bookmark
- Subscribe
- Mute
- Printer Friendly Page
Turn on suggestions
Auto-suggest helps you quickly narrow down your search results by suggesting possible matches as you type.
Showing results for

 nihar1411
Contributor II
2020-04-01
06:36 PM
- Mark as New
- Bookmark
- Subscribe
- Mute
- Subscribe to RSS Feed
- Permalink
- Report Inappropriate Content
Use Rangesum to make Stacked bar chart with categores
Hi,
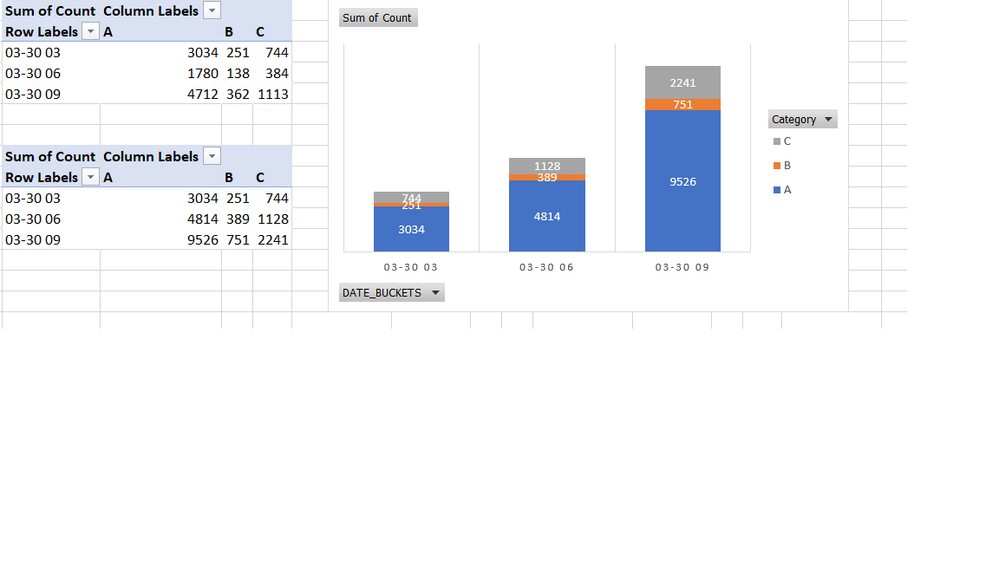
I am trying to create a stacked bar chart such that it shows the cummulative sum.
I can easily do this in EXCEL by making a pivot, and the adding a Running Total In column to make a bar chart.
Hoever i am struggling since 6 hrs to find a fix in qlik.. I am using the formula rangesum(above(TOTAL Sum( Count),0,RowNo(total))). I can make a bar chart with total count, however when i add the categories, the graphs gives way.
I am attaching the excel with test data
Thanks in Advance!
- Tags:
- rangesum
1,636 Views
2 Replies

 msKarthikeyan
Employee
2020-04-01
10:51 PM
- Mark as New
- Bookmark
- Subscribe
- Mute
- Subscribe to RSS Feed
- Permalink
- Report Inappropriate Content
Hi Nihar,
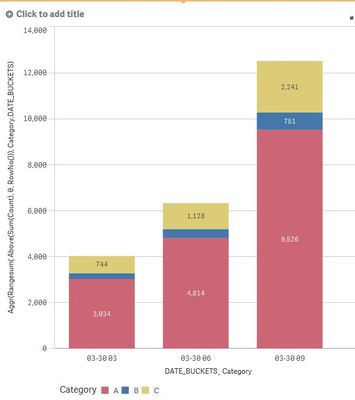
Try this.
Aggr(Rangesum( Above(Sum(Count), 0, RowNo())), Category,DATE_BUCKETS)
-Karthik
1,611 Views
nihar1411
Contributor II
2020-04-02
09:04 AM
Author
- Mark as New
- Bookmark
- Subscribe
- Mute
- Subscribe to RSS Feed
- Permalink
- Report Inappropriate Content
Thanks Karthik..
This helps and works 🙂
1,592 Views
