Unlock a world of possibilities! Login now and discover the exclusive benefits awaiting you.

- Qlik Community
- :
- Forums
- :
- Analytics & AI
- :
- Products & Topics
- :
- Visualization and Usability
- :
- Variation % trough years
- Subscribe to RSS Feed
- Mark Topic as New
- Mark Topic as Read
- Float this Topic for Current User
- Bookmark
- Subscribe
- Mute
- Printer Friendly Page

 ptl14624
- Mark as New
- Bookmark
- Subscribe
- Mute
- Subscribe to RSS Feed
- Permalink
- Report Inappropriate Content
Variation % trough years
Hi all!
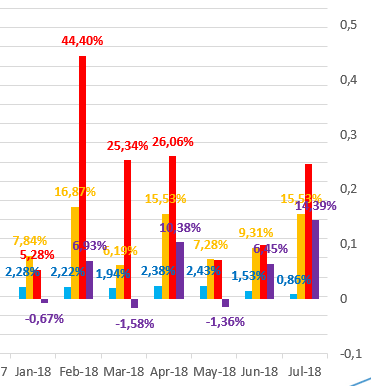
I want to present a ComboChart where I could show the variation (%) for each consumable, from the last year to this one.
In general, something like the image below.
Any ideas about which formula should I use?
Thanks

 OmarBenSalem
- Mark as New
- Bookmark
- Subscribe
- Mute
- Subscribe to RSS Feed
- Permalink
- Report Inappropriate Content
Put only Month as a dimension (not year-Monthy), consumable as second dimension
and as a measure, sthing like:
(sum({<Date,Month,YearMonth, Year={"$(=max(Year))"}>}Value)
-
sum({<Date,Month,YearMonth, Year={"$(=max(Year)-1)"}>}Value))
/
sum({<Date,Month,YearMonth, Year={"$(=max(Year)-1)"}>}Value)
ptl14624
- Mark as New
- Bookmark
- Subscribe
- Mute
- Subscribe to RSS Feed
- Permalink
- Report Inappropriate Content
Thanks for your reply!
However, still some doubts:
In this part: "$(=max(Year))" , The $ stands for what? Should I use it just like that?
Thanks
OmarBenSalem
- Mark as New
- Bookmark
- Subscribe
- Mute
- Subscribe to RSS Feed
- Permalink
- Report Inappropriate Content
max(date) is a function so it needs an "=" sign:
=max(date)
when we have a '=' we add the $ (before each calculation) : $(=max(date) )
and then u surround the whole with doubles quotes
so : Date={"$(=max(Date))"}
if u were performing a conditon on an integer, u write it directly without quotes :
Year={2018}
if it's a string, u put quotes:
Country={'Tunisia'}
