Unlock a world of possibilities! Login now and discover the exclusive benefits awaiting you.
Announcements
Data Works for AI is here - Join the discussion and enter to win a pair of Qlik kicks: Join the Conversation!
- Qlik Community
- :
- Forums
- :
- Analytics & AI
- :
- Products & Topics
- :
- Visualization and Usability
- :
- Visualization Barplot vs Combo Chart
Options
- Subscribe to RSS Feed
- Mark Topic as New
- Mark Topic as Read
- Float this Topic for Current User
- Bookmark
- Subscribe
- Mute
- Printer Friendly Page
Turn on suggestions
Auto-suggest helps you quickly narrow down your search results by suggesting possible matches as you type.
Showing results for
Contributor III
2020-06-18
05:21 AM
- Mark as New
- Bookmark
- Subscribe
- Mute
- Subscribe to RSS Feed
- Permalink
- Report Inappropriate Content
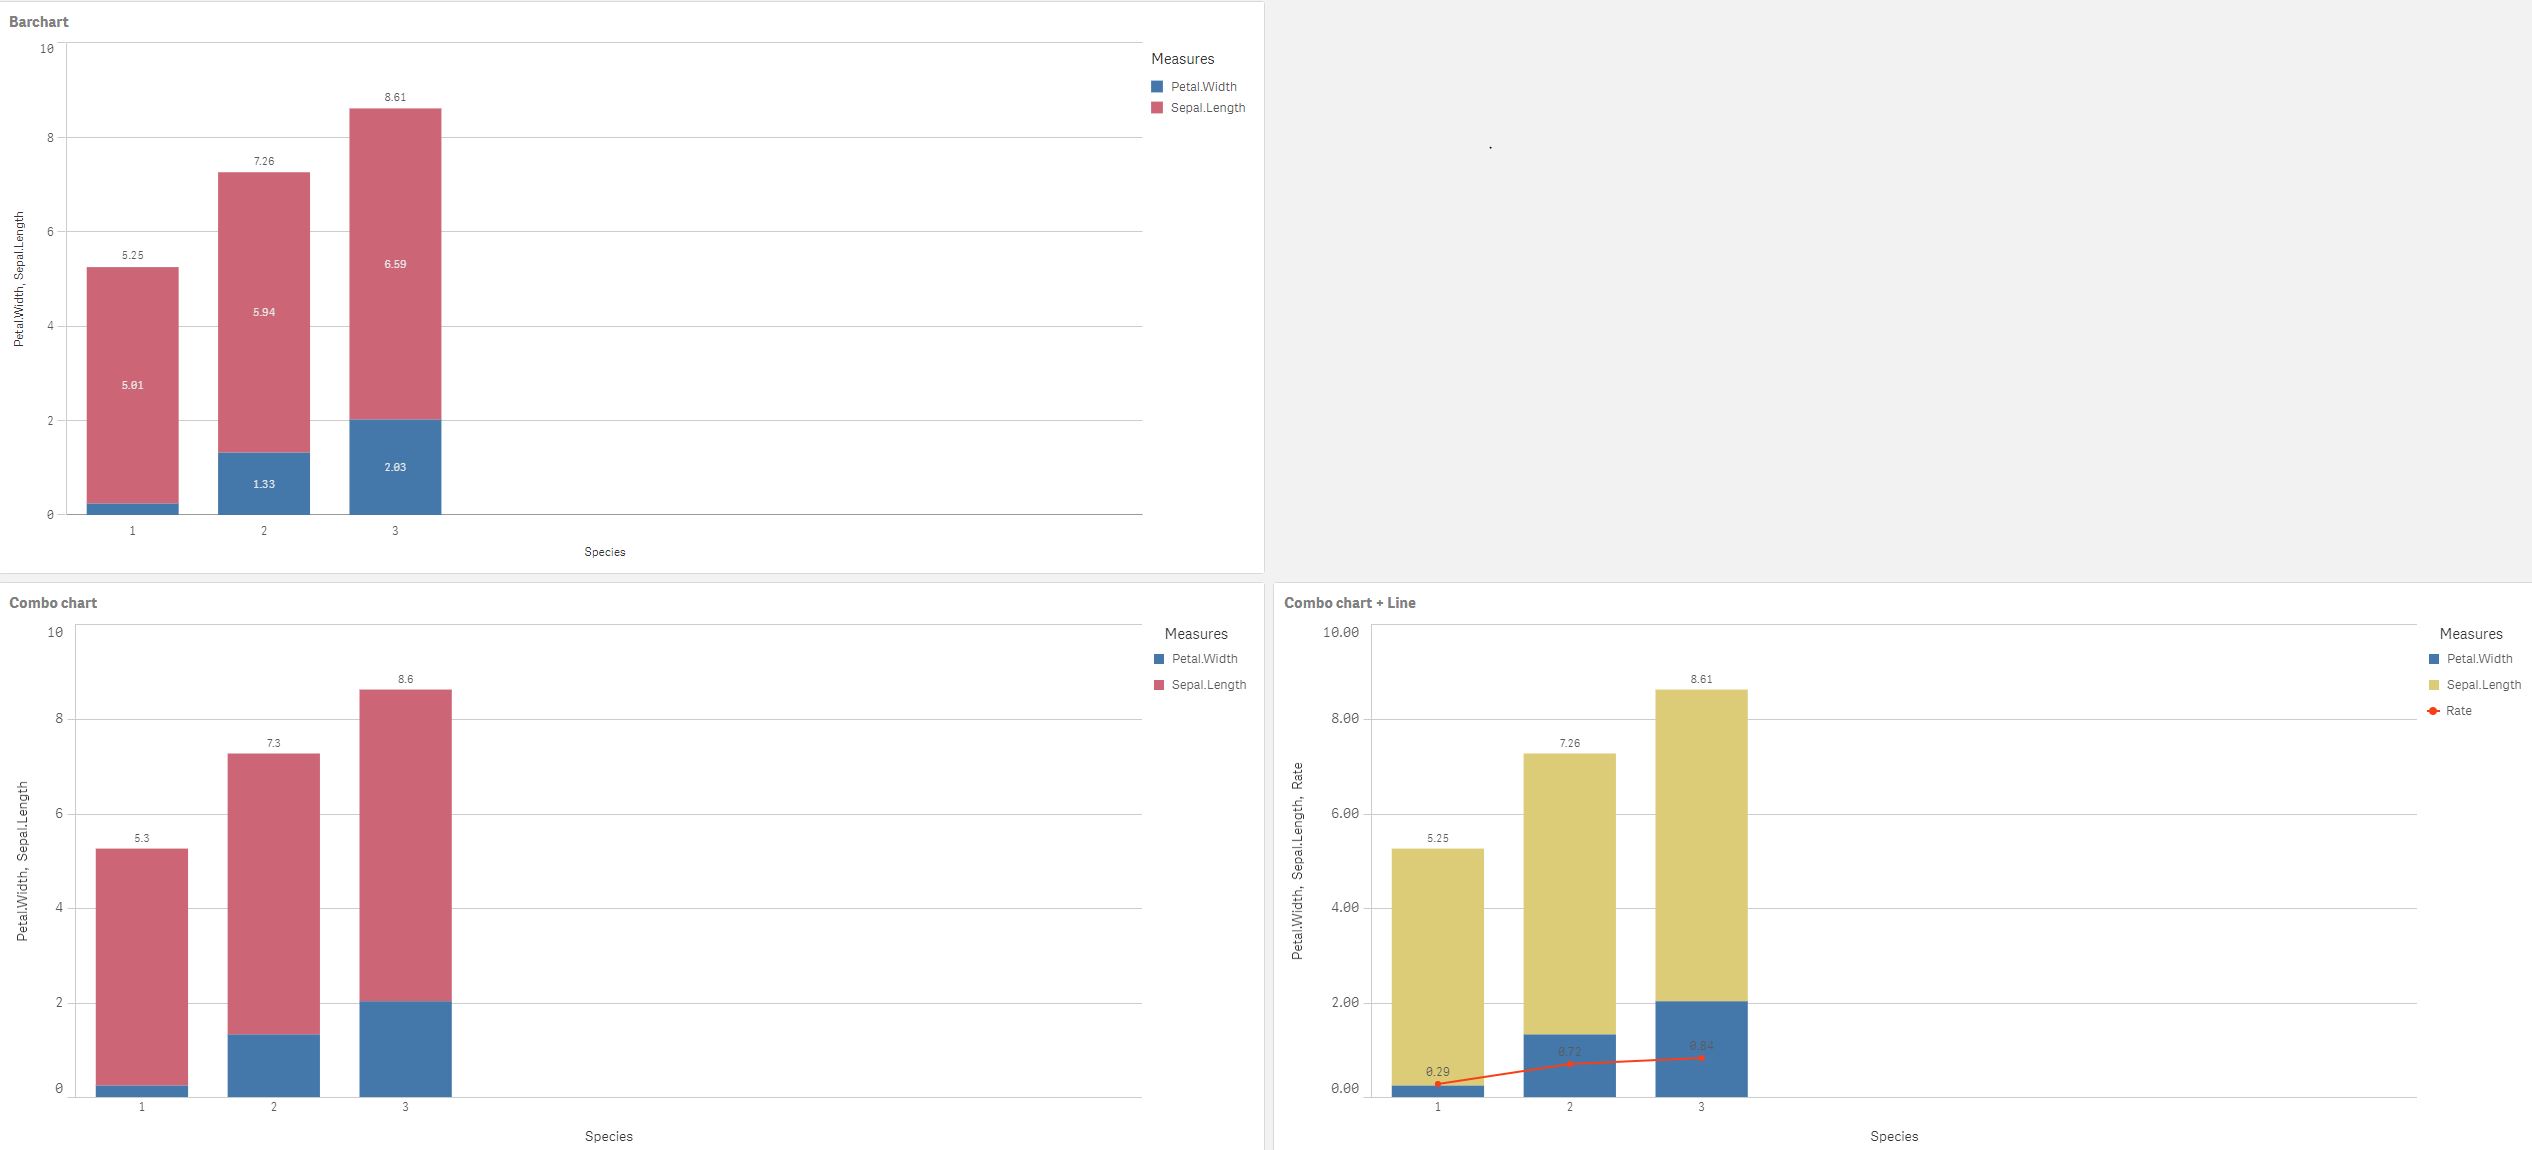
Visualization Barplot vs Combo Chart
Hi guys,
I'm kind of stuck. I want to have a perfect visualization and have therefore 3 questions:
1. In bar-charts i can show the segment labels, how can i do that in a combo-chart?
2. If I have several measurements, i can not label my Y-axis useful anymore. In the case of my appendix, it would be nice to show as label: "length [cm]" (If would have one dimension, I could do a work-around and rename the measurement in the data to "length")
3. I have added a line to the combo-chart but now the color of font is hard readable. Is it possible to fix that somehow?

I hope you can help me
Cheers
Alex
922 Views
0 Replies