Unlock a world of possibilities! Login now and discover the exclusive benefits awaiting you.

Announcements
Want to see what's currently in public preview? We've pulled it all together in one place. Check it out here
- Qlik Community
- :
- Forums
- :
- Analytics & AI
- :
- Products & Topics
- :
- Visualization and Usability
- :
- Waterfall Chart with negative values
Options
- Subscribe to RSS Feed
- Mark Topic as New
- Mark Topic as Read
- Float this Topic for Current User
- Bookmark
- Subscribe
- Mute
- Printer Friendly Page
Turn on suggestions
Auto-suggest helps you quickly narrow down your search results by suggesting possible matches as you type.
Showing results for

 adhudson
Creator II
2018-09-18
03:25 AM
- Mark as New
- Bookmark
- Subscribe
- Mute
- Subscribe to RSS Feed
- Permalink
- Report Inappropriate Content
Waterfall Chart with negative values
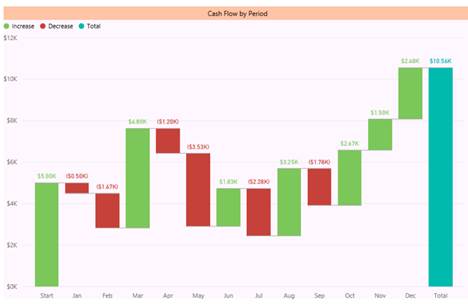
Is there any way to develop a chart like shown below?
- Dimension – Year Month
- Measure – No of alerts generated by iComfort Devices.
- Coloring – Alerts generated by Current Month > Previous Month -> Green – Alerts generated by Current Month < Previous Month -> Red
- Tags:
- waterfall_chart
1,802 Views
2 Replies

 Ivan_Bozov
Luminary
2018-09-18
03:46 AM
- Mark as New
- Bookmark
- Subscribe
- Mute
- Subscribe to RSS Feed
- Permalink
- Report Inappropriate Content
Hi! As the waterfall chart supports only measures, I guess you will have to create a measure for each month and assign custom colors, e.g. something like
January:
Measure: SUM({<Month={'January'}>}Alerts)
Custom color: GREEN()
February:
Measure: SUM({<Month={'February'}>}Alerts) - SUM({<Month={'January'}>}Alerts) to see if there is an increase or decrease
Custom color: IF(SUM({<Month={'February'}>}Alerts) - SUM({<Month={'January'}>}Alerts) > 0, GREEN(), RED())
March:
You got the drill.
vizmind.eu
1,742 Views
Ivan_Bozov
Luminary
2018-09-20
03:45 AM
- Mark as New
- Bookmark
- Subscribe
- Mute
- Subscribe to RSS Feed
- Permalink
- Report Inappropriate Content
So does this work for you?
vizmind.eu
1,742 Views
