Unlock a world of possibilities! Login now and discover the exclusive benefits awaiting you.

- Qlik Community
- :
- Forums
- :
- Analytics & AI
- :
- Products & Topics
- :
- Visualization and Usability
- :
- Week Range on chart
- Subscribe to RSS Feed
- Mark Topic as New
- Mark Topic as Read
- Float this Topic for Current User
- Bookmark
- Subscribe
- Mute
- Printer Friendly Page

 arindam_bhadra
- Mark as New
- Bookmark
- Subscribe
- Mute
- Subscribe to RSS Feed
- Permalink
- Report Inappropriate Content
Week Range on chart
Hi Team,
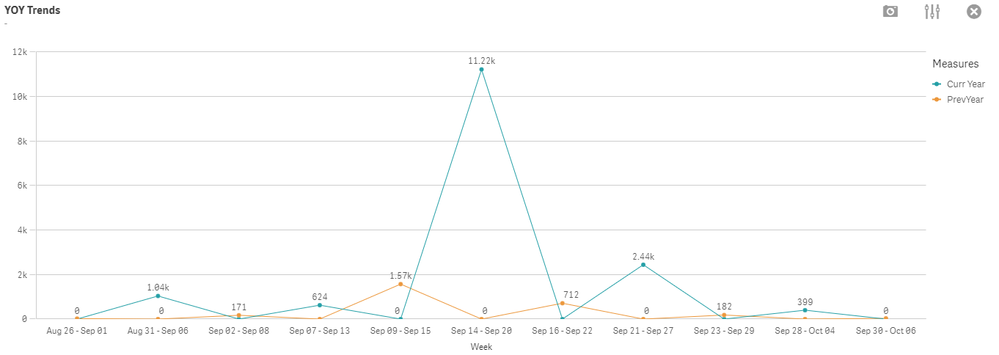
I am new to Qlik and I am stuck on a chart representation. In my chart I am trying to show an YOY for current and previous year on weekly basis. The codes for the measures are as follows:
Curr Year: sum({<Table_Flag={'Funnel_Stage_New'}, DATE_OVERALL= {">=$(=Min(DATE_OVERALL))<=$(=Max(DATE_OVERALL))"}>} nbr)
Prev Year: sum({<Table_Flag={'Funnel_Stage_New'}, DATE_OVERALL= {">=$(=Min(PreYear))<=$(=Max(PreYear))"}> } nbr)
and the dimension is
=Date(WeekStart(DATE_OVERALL),'MMM DD')&' - '&(Date(WeekEnd(DATE_OVERALL),'MMM DD'))
As it is present on the chart that the week ranges are not in alignment for both the year. I need a solution to put the week range same for both the years. Please suggest solutions.
The date range is from Sept 1 to Sept 30.
Thanks