Unlock a world of possibilities! Login now and discover the exclusive benefits awaiting you.

- Qlik Community
- :
- Forums
- :
- Analytics & AI
- :
- Products & Topics
- :
- Visualization and Usability
- :
- Yet another Moving annual total (MAT) question
Options
- Subscribe to RSS Feed
- Mark Topic as New
- Mark Topic as Read
- Float this Topic for Current User
- Bookmark
- Subscribe
- Mute
- Printer Friendly Page
Turn on suggestions
Auto-suggest helps you quickly narrow down your search results by suggesting possible matches as you type.
Showing results for

 gbernabo
Contributor II
2020-11-13
03:11 PM
- Mark as New
- Bookmark
- Subscribe
- Mute
- Subscribe to RSS Feed
- Permalink
- Report Inappropriate Content
Yet another Moving annual total (MAT) question
Dear Qliksensers, I've been reading this forum looking for this answer many times to no avail.
I need to create a bar chart with the sum of my data grouped in MATs, that is the last month I have loaded (usualy two months before the actual date) plus the previous 11 months.
I've created the autocalendar but I have no idea how to get from that to MAT, only to YTD.
My data looks like this:
| Sales | Imp_date |
| 20117 | 2020-Sep |
| 7829 | 2020-Aug |
| 13415 | 2020-Jul |
| 14975 | 2020-Jun |
| 16716 | 2020-May |
| 22004 | 2020-Apr |
| 5919 | 2020-Mar |
| 16049 | 2020-Feb |
And so on until 2007-Jan
And I expect to get a chart like this:
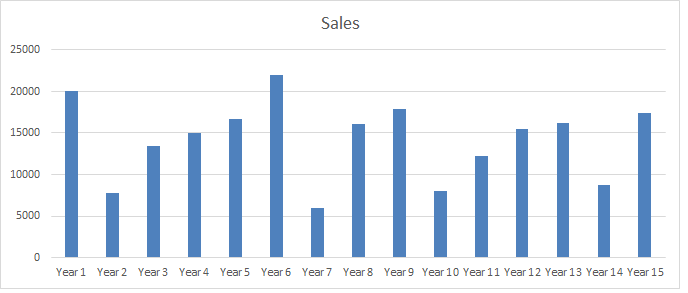
Where each Year is the sum of 12 months.
Can you give me a clue as how to work this out?
I've attached a mock data file to use as example.
Thank you in advance!
- Tags:
- date
876 Views
0 Replies
