Unlock a world of possibilities! Login now and discover the exclusive benefits awaiting you.

- Qlik Community
- :
- Forums
- :
- Analytics & AI
- :
- Products & Topics
- :
- Visualization and Usability
- :
- Re: Zoom line chart with time dimension by selecti...
- Subscribe to RSS Feed
- Mark Topic as New
- Mark Topic as Read
- Float this Topic for Current User
- Bookmark
- Subscribe
- Mute
- Printer Friendly Page

 Enriquemmesteo
- Mark as New
- Bookmark
- Subscribe
- Mute
- Subscribe to RSS Feed
- Permalink
- Report Inappropriate Content
Zoom line chart with time dimension by selecting the range
Hello everyone,
I have a line chart with a time dimension on the X-axis and "sum(sales)/$(vtotalsales) " as a measure with the accumulate box checked for this measure in the chart options.
This allows us to see a percentage from 0 to 100 of the sales during all the timespan.
Usually, they want to zoom for the time between two particular dates by selecting it on the X-axis. This is a problem cause it selects those dates and changes the values of the percentage for those months when it should just zoom but keep the same values.
I tried using set analysis too sum({<period>}sales)/$(vtotalsales) but this doesn't work either because it doesn't zoom when the rage of dates is selected on the x-axis.
Thanks!

 marinadorcassio
- Mark as New
- Bookmark
- Subscribe
- Mute
- Subscribe to RSS Feed
- Permalink
- Report Inappropriate Content
Enriquemmesteo
- Mark as New
- Bookmark
- Subscribe
- Mute
- Subscribe to RSS Feed
- Permalink
- Report Inappropriate Content
Hello, using total doesnt exactly work. This is the full curve before trying to zoom, using the measure sum(sales) and the accumulate option:
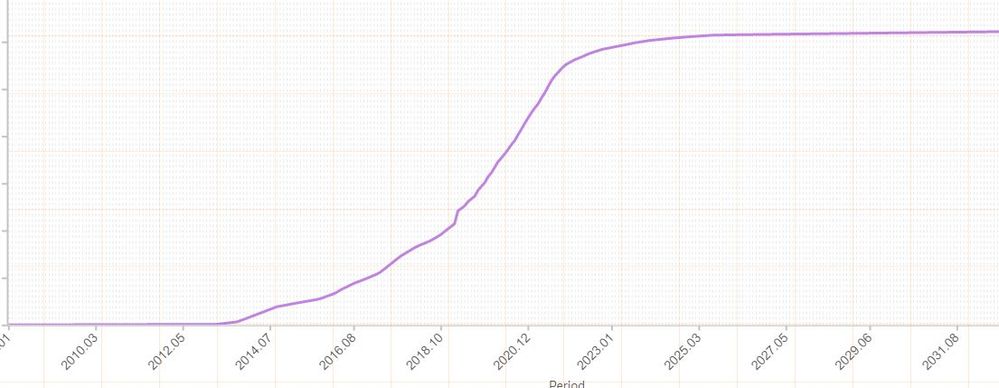
If select on the x axis from 2020.01 to 2022.01 it will zoom these periods but it will also change the line because the measure reacts to the periods selected. I want this selection to act like a zoom for this chart if possible.
If I use set analysis: sum({<Period>}sales) the curve won't change...but it wont zoom.
If I use total: sum(total sales), the curve it's not the same:

