Unlock a world of possibilities! Login now and discover the exclusive benefits awaiting you.

- Qlik Community
- :
- Forums
- :
- Analytics & AI
- :
- Products & Topics
- :
- Visualization and Usability
- :
- aggr issue in bar graph
- Subscribe to RSS Feed
- Mark Topic as New
- Mark Topic as Read
- Float this Topic for Current User
- Bookmark
- Subscribe
- Mute
- Printer Friendly Page

 Pragya
- Mark as New
- Bookmark
- Subscribe
- Mute
- Subscribe to RSS Feed
- Permalink
- Report Inappropriate Content
aggr issue in bar graph
Hi all,
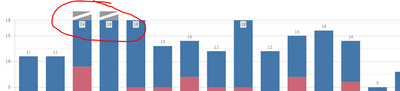
I have a bar graph where sometimes if value of one bar is higher than other bar i find a grey space on the top of the bar graph. Which is something like this:
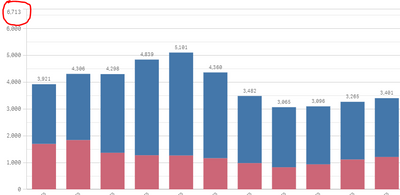
I used aggr formula here but then the issue i got is, the graph has non rounded value. Can i use something that after aggr formula, it rounds to nears 500 or thousand.
The formula i am using is
=max(aggr(count (distinct Column_measure),Dimension1,Dimension2)) * 1.75
Accepted Solutions

 avinashelite
- Mark as New
- Bookmark
- Subscribe
- Mute
- Subscribe to RSS Feed
- Permalink
- Report Inappropriate Content
Try like this
=round(max(aggr(count (distinct Column_measure),Dimension1,Dimension2)) * 1.75,100)
avinashelite
- Mark as New
- Bookmark
- Subscribe
- Mute
- Subscribe to RSS Feed
- Permalink
- Report Inappropriate Content
Do you need to the forced zero axis ? I mean to start the scale with 0 if you disable then according to the data it will get auto aligned
Pragya
- Mark as New
- Bookmark
- Subscribe
- Mute
- Subscribe to RSS Feed
- Permalink
- Report Inappropriate Content
I need the force zero axis
avinashelite
- Mark as New
- Bookmark
- Subscribe
- Mute
- Subscribe to RSS Feed
- Permalink
- Report Inappropriate Content
Try like this
=round(max(aggr(count (distinct Column_measure),Dimension1,Dimension2)) * 1.75,100)
Pragya
- Mark as New
- Bookmark
- Subscribe
- Mute
- Subscribe to RSS Feed
- Permalink
- Report Inappropriate Content
You are a star!
Thankyou - it works
