Unlock a world of possibilities! Login now and discover the exclusive benefits awaiting you.

- Qlik Community
- :
- Forums
- :
- Analytics & AI
- :
- Products & Topics
- :
- Visualization and Usability
- :
- changing chart according to slider(variable input)...
Options
- Subscribe to RSS Feed
- Mark Topic as New
- Mark Topic as Read
- Float this Topic for Current User
- Bookmark
- Subscribe
- Mute
- Printer Friendly Page
Turn on suggestions
Auto-suggest helps you quickly narrow down your search results by suggesting possible matches as you type.
Showing results for

 alphabetagamma
Contributor
2021-05-25
08:21 AM
- Mark as New
- Bookmark
- Subscribe
- Mute
- Subscribe to RSS Feed
- Permalink
- Report Inappropriate Content
changing chart according to slider(variable input),variables
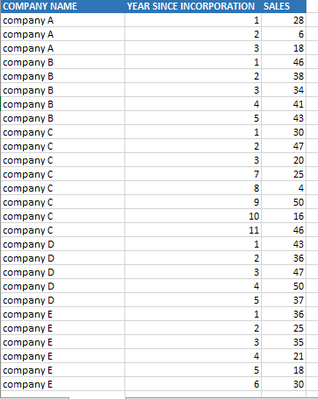
The data is like this, I want to create a graph which changes according to the cut-off slider.
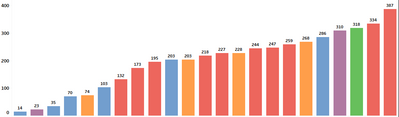
When we choose the value at slider, I want the minimum year since incorporation where the cut-off (sales) has been achieved for that company on y-axis and company name on x-axis .
desired output

860 Views
0 Replies
