Unlock a world of possibilities! Login now and discover the exclusive benefits awaiting you.
- Qlik Community
- :
- Forums
- :
- Analytics & AI
- :
- Products & Topics
- :
- Visualization and Usability
- :
- compare count of each string value to a measure
- Subscribe to RSS Feed
- Mark Topic as New
- Mark Topic as Read
- Float this Topic for Current User
- Bookmark
- Subscribe
- Mute
- Printer Friendly Page
- Mark as New
- Bookmark
- Subscribe
- Mute
- Subscribe to RSS Feed
- Permalink
- Report Inappropriate Content
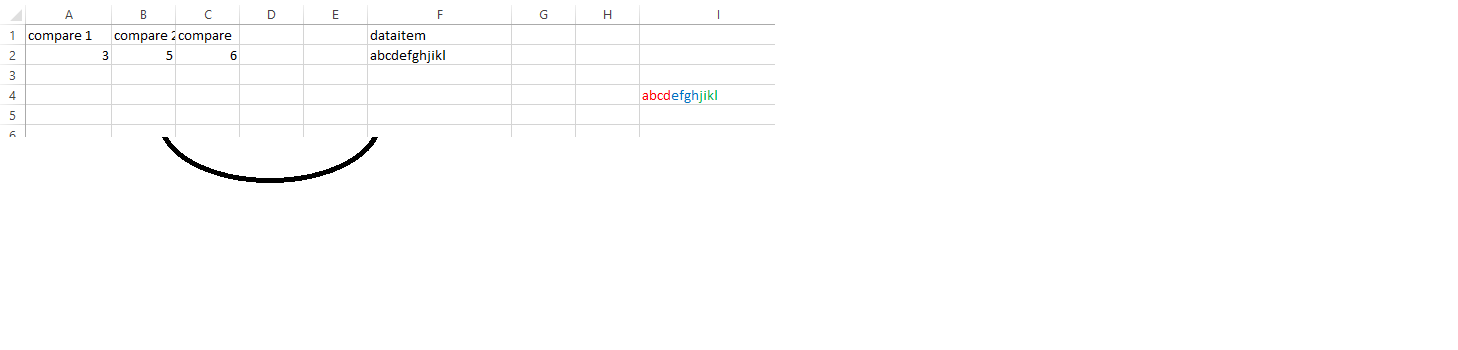
compare count of each string value to a measure
Is there a way to compare the count of position of 'a' ,'b','c','d',.......'l' o Compare 1 and color code the text?
rangesum(num(count(distinct left('abcdefghijk','1')))) gives me 1
rangesum(num(count(distinct left('abcdefghijk','2')))) gives me 1
i couldnt figure out how to write a comparison stmt.
is this possible?
thanks
- Tags:
- rangesum
- Mark as New
- Bookmark
- Subscribe
- Mute
- Subscribe to RSS Feed
- Permalink
- Report Inappropriate Content
talk is cheap, supply exceeds demand
- Mark as New
- Bookmark
- Subscribe
- Mute
- Subscribe to RSS Feed
- Permalink
- Report Inappropriate Content
What ever, You done quiet not correct to me as the syntax itself makes wrong. Because, Not sure - Why RangeSum() needed for you?
Perhaps you can try this?
SubStringCount(FieldName, 'A') as Field_A
SubStringCount(FieldName, 'B') as Field_B
SubStringCount(FieldName, 'C') as Field_C
- Mark as New
- Bookmark
- Subscribe
- Mute
- Subscribe to RSS Feed
- Permalink
- Report Inappropriate Content
thanks
- Mark as New
- Bookmark
- Subscribe
- Mute
- Subscribe to RSS Feed
- Permalink
- Report Inappropriate Content
let me post it and explain it better , I have been working on actual data, I am just struggling on trimming it down to sample and make it clear and simple as much as possible.
thanks .
- Mark as New
- Bookmark
- Subscribe
- Mute
- Subscribe to RSS Feed
- Permalink
- Report Inappropriate Content
Hi sorry for the delayed reply. By basic need is to get a 100% stacked chart in a table .I think I solved it finally. There is alot of work around though.
I have a mix a excel logics to get the 100 % stacked bar chart. The reason I wanted to use a Range function is I wanted to take 100 cells as we take in excel and compare the ranges of my measures with that cell range. But didnt know which one to get it . I tried to replicate this in Qlik. https://trumpexcel.com/stacked-bar-chart-in-excel/.
I figured I have to use Rangeonly function to get the 100% stacked bar chart.
AS 100 % was too much to show in a column I wanted to reduce the %- so 20% stacked is reduced chart.
droop quota distributions(https://en.wikipedia.org/wiki/Droop_quota) to reduce it to 20% stacked chart ( as I understand from ruby - How to deal with the sum of rounded percentage not being 100? - Stack Overflow)
How to deal with the sum of rounded percentage not being 100?

thanks