Unlock a world of possibilities! Login now and discover the exclusive benefits awaiting you.

- Qlik Community
- :
- Forums
- :
- Analytics & AI
- :
- Products & Topics
- :
- Visualization and Usability
- :
- Re: cumulative sum in bar chart
- Subscribe to RSS Feed
- Mark Topic as New
- Mark Topic as Read
- Float this Topic for Current User
- Bookmark
- Subscribe
- Mute
- Printer Friendly Page

 L_Hop
L_Hop
- Mark as New
- Bookmark
- Subscribe
- Mute
- Subscribe to RSS Feed
- Permalink
- Report Inappropriate Content
cumulative sum in bar chart
Hello everyone,
I am trying to calculate cumulative sum in a bar chart in Qlik Sense which has two dimensions; month and year. My measure is sum of Sales.
What I want is, sales values should be cumulatively summed in bar chart for the selected months.
For example: March 2016 sales values should be sum of Jan 2016 and Feb 2016 on pivot table and rest of them also should be the same.
Right now I have below bar chart, it is only showing the related month year sales data.
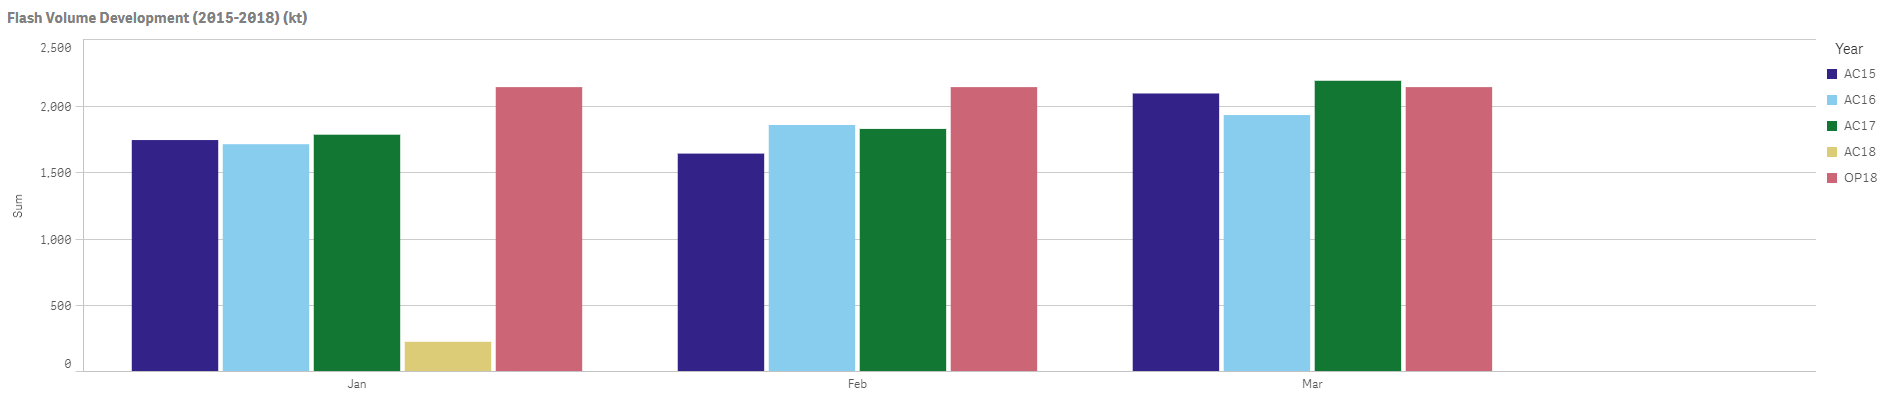
I have tried "=RangeSum(Above(Sum(Sales), 0, RowNo(total)))" but it has not worked. Result of the "=RangeSum(Above(Sum(Sales), 0, RowNo(total)))" is below picture.
.PNG)
Please suggest me any solution if anyone of you gone through the same problem.
Thanks.
OY

 OmarBenSalem
- Mark as New
- Bookmark
- Subscribe
- Mute
- Subscribe to RSS Feed
- Permalink
- Report Inappropriate Content
already told him to do so; but It STRANGERLY does not appear the way it should be..
aggr(rangesum(above(Sum(Sales),0,RowNo())),SecondDim,FirstDim)

 sunny_talwar
- Mark as New
- Bookmark
- Subscribe
- Mute
- Subscribe to RSS Feed
- Permalink
- Report Inappropriate Content
I think you mentioned Second and First dimension, which isn't very clear.... should have just used Year, Month because we can see the names of the dimension from the image  . I don't see why it would not work...
OmarBenSalem
- Mark as New
- Bookmark
- Subscribe
- Mute
- Subscribe to RSS Feed
- Permalink
- Report Inappropriate Content
I think this should work :
sum({<Month={"=$(=max(Month))"}>}aggr(rangesum(above(Sum({<Year,Month>}Sales),0,RowNo())),Year,Month))
Result:
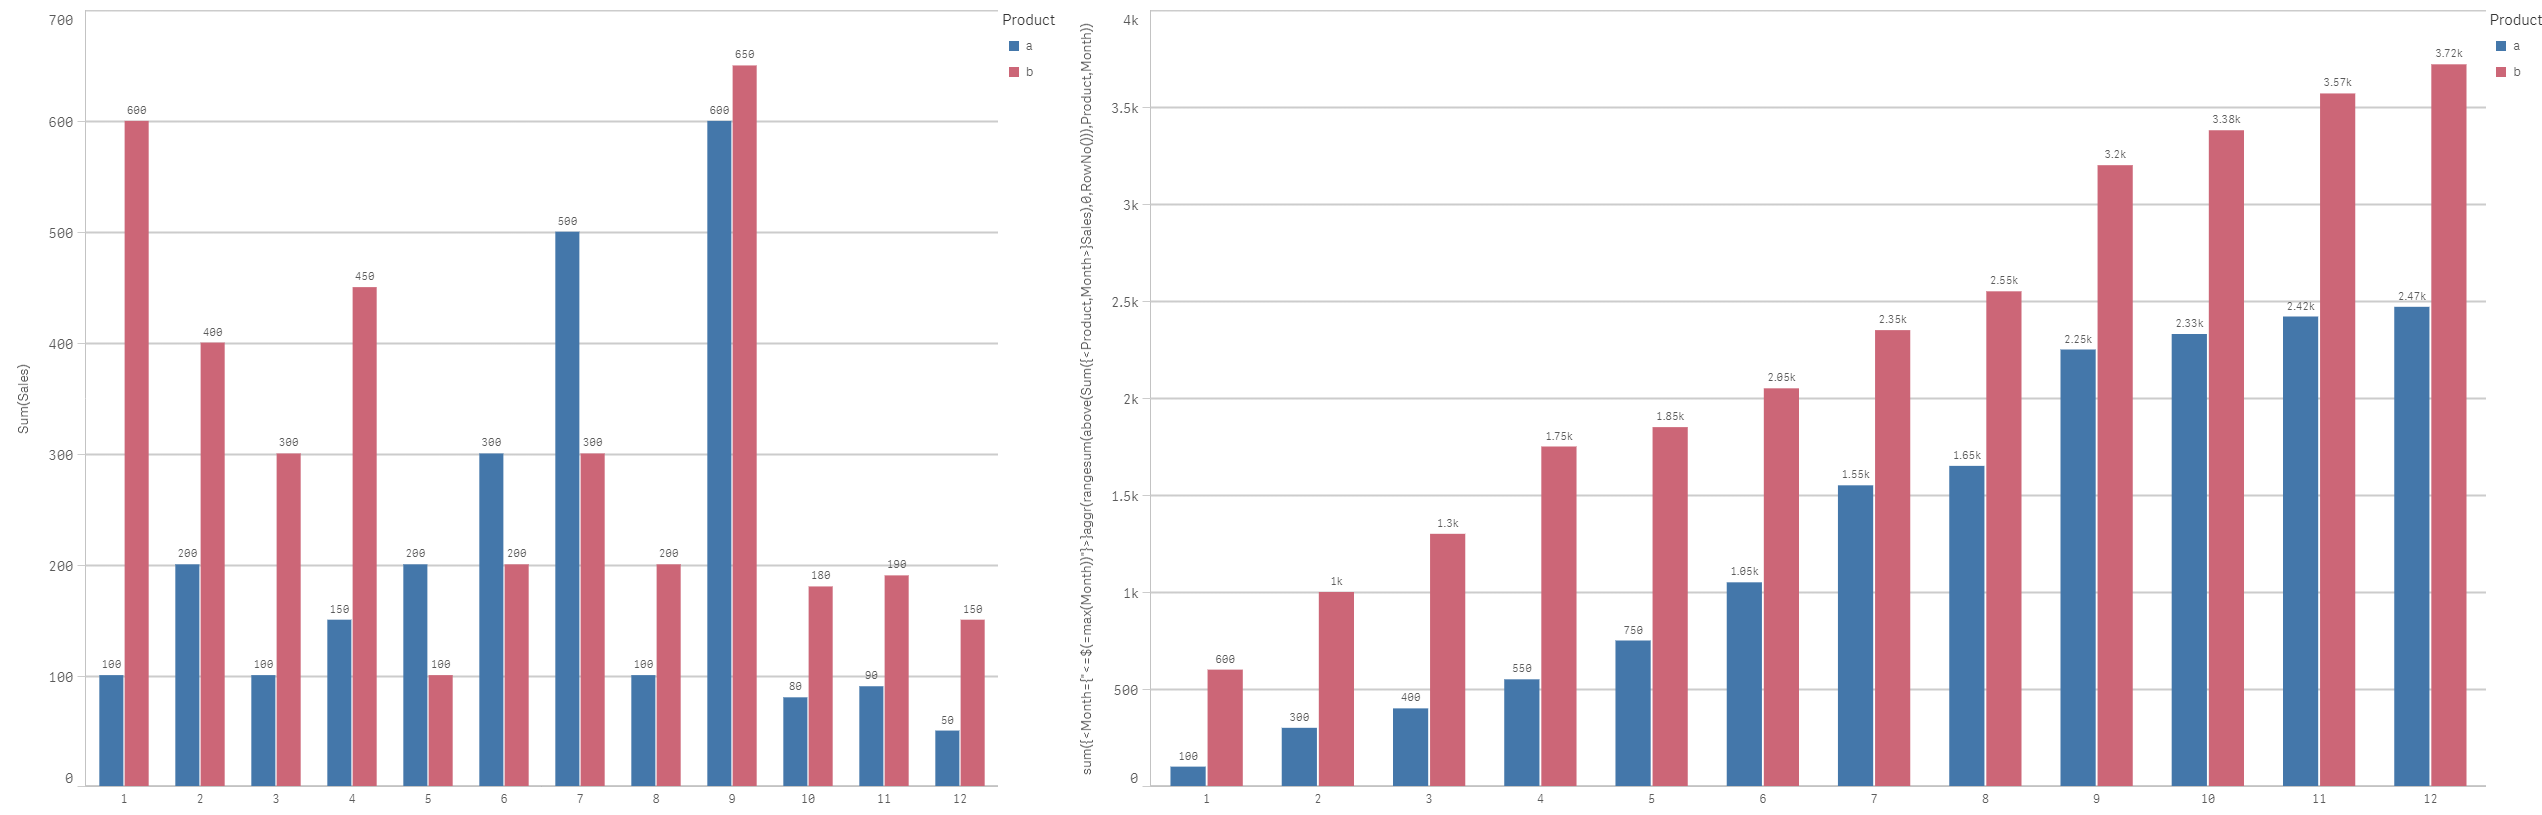
and when we select a Month:
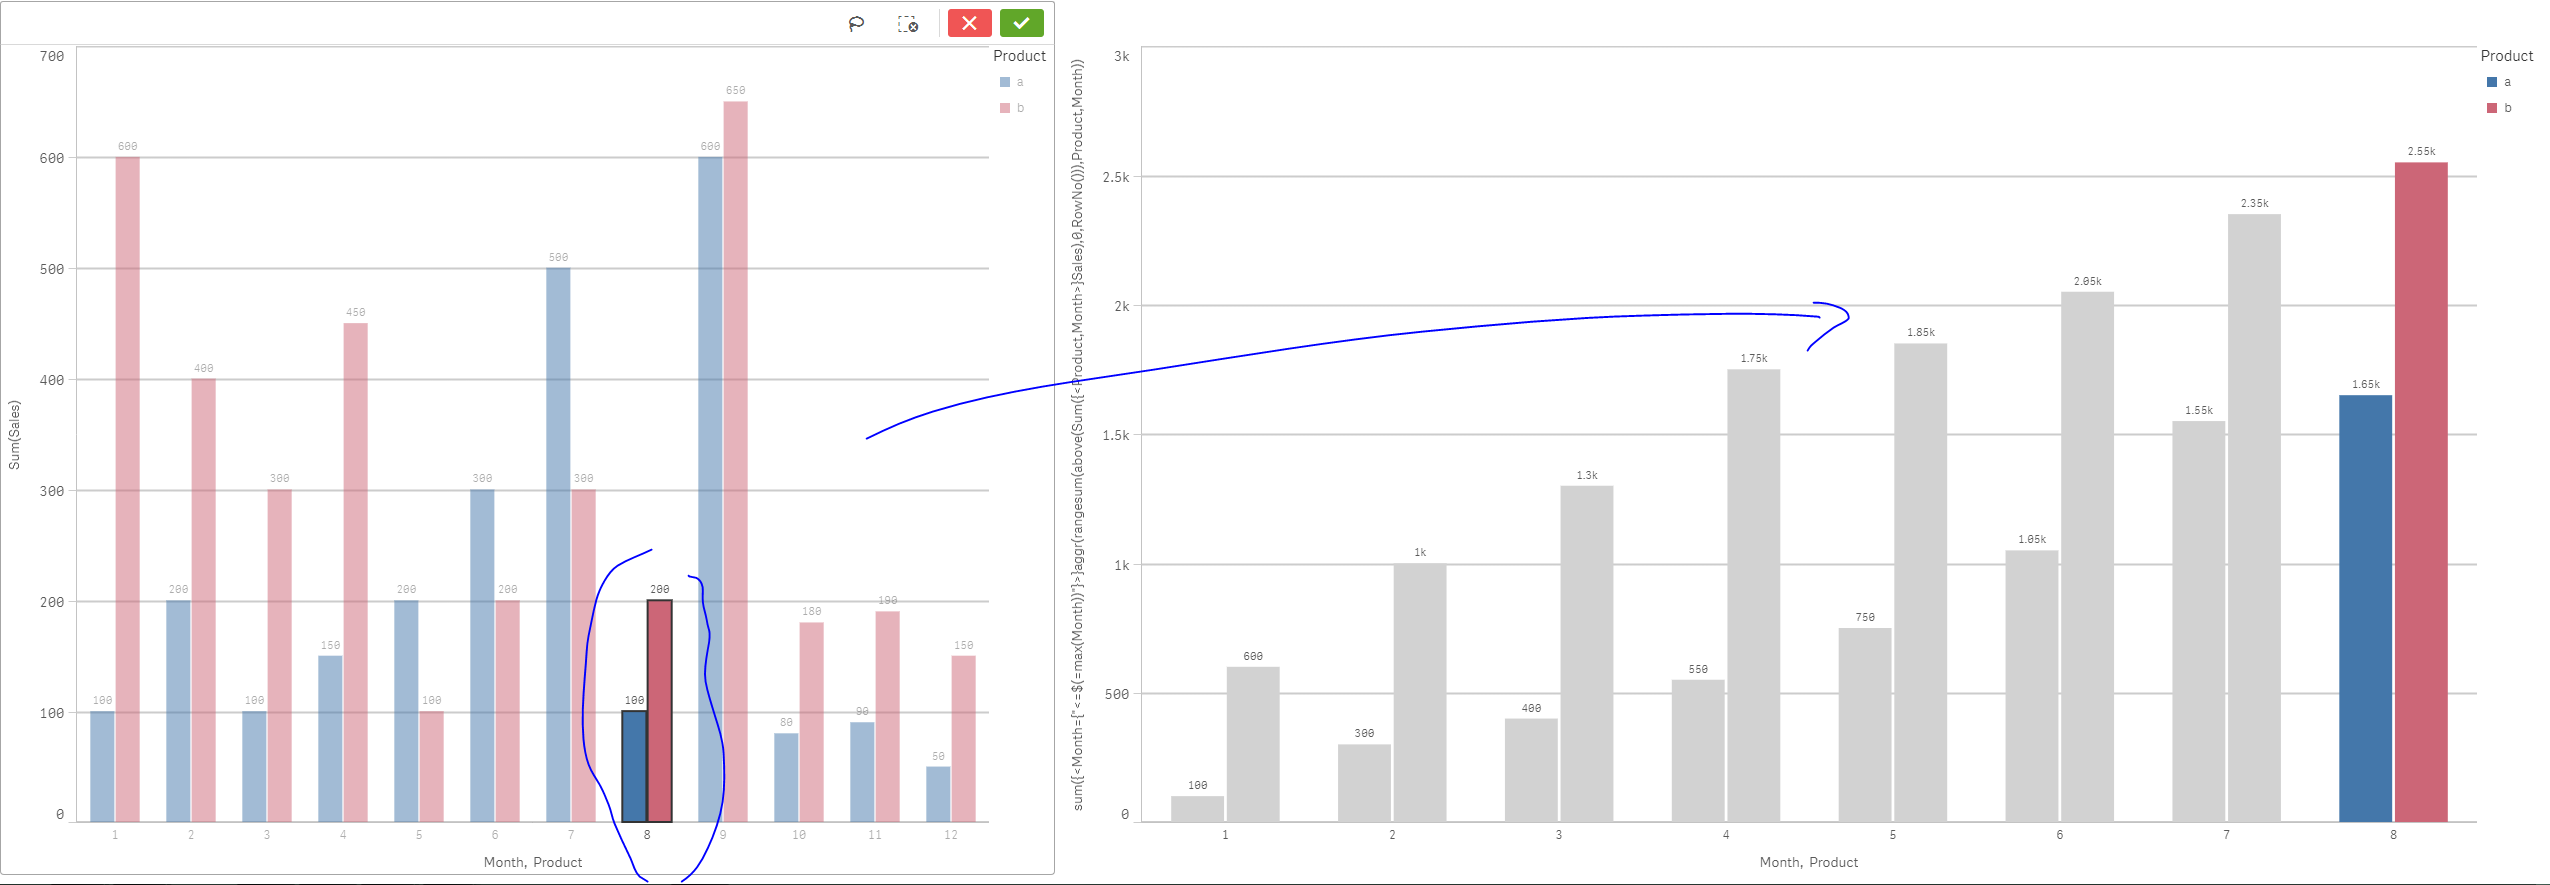
OmarBenSalem
- Mark as New
- Bookmark
- Subscribe
- Mute
- Subscribe to RSS Feed
- Permalink
- Report Inappropriate Content
Maybe .. Cause I was giving him an exp per analogy with other dimensions I was using; my bad
L_Hop
- Mark as New
- Bookmark
- Subscribe
- Mute
- Subscribe to RSS Feed
- Permalink
- Report Inappropriate Content
thank you for your efforts but all the suggested codes not worked.
When I have used the below code, the output of is:
sum({<Month={"=$(=max(Month))"}>}aggr(rangesum(above(Sum({<Year,Month>}Sales),0,RowNo())),Year,Month))
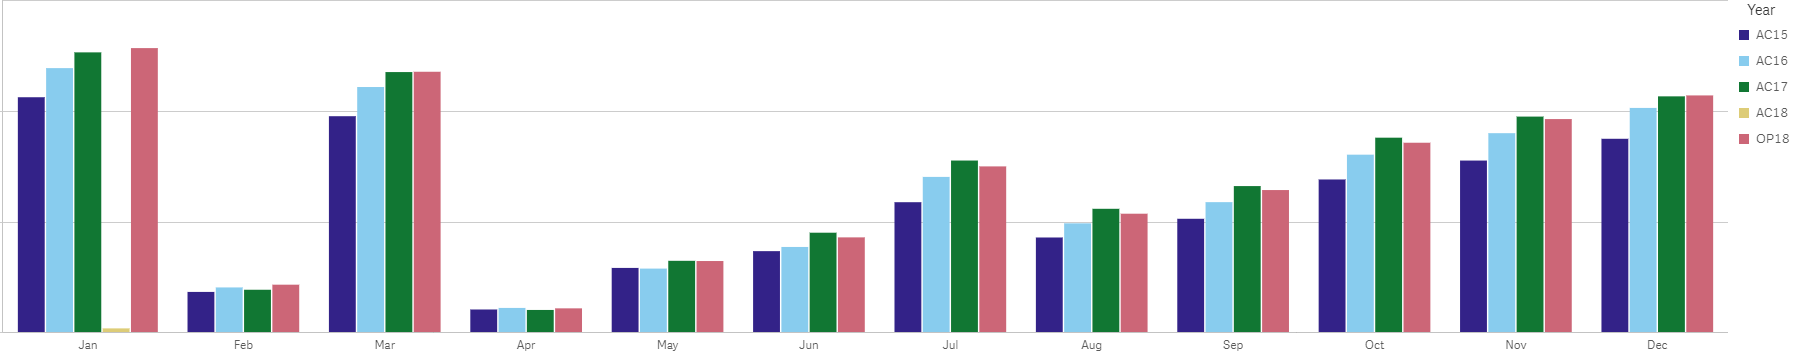
I have only two dimesion, first one month, second one Year.
year values are: ac15 - actual 2015
: ac16
: ac17
: ac18
: op18 - plan 2018
ac18 only has january data, all the other years have the whole month data.
month values are: Jan, Feb etc.
measure is sum of sales
regards;
OY
sunny_talwar
- Mark as New
- Bookmark
- Subscribe
- Mute
- Subscribe to RSS Feed
- Permalink
- Report Inappropriate Content
Give this a shot
Aggr(RangeSum(Above(Sum(Sales), 0, RowNo())),Year, (Month, (NUMERIC)))
L_Hop
- Mark as New
- Bookmark
- Subscribe
- Mute
- Subscribe to RSS Feed
- Permalink
- Report Inappropriate Content
there is no numeric function in Qlik sense and I have used NumericCount function and it has worked, Thank you.
Aggr(RangeSum(Above(Sum(Sales), 0, RowNo())),Year, (Month, (NumericCount)))
regards;
OY
sunny_talwar
- Mark as New
- Bookmark
- Subscribe
- Mute
- Subscribe to RSS Feed
- Permalink
- Report Inappropriate Content
NUMERICCOUNT? Really? I don't even know what that does... does it not work with just NUMERIC?
OmarBenSalem
- Mark as New
- Bookmark
- Subscribe
- Mute
- Subscribe to RSS Feed
- Permalink
- Report Inappropriate Content
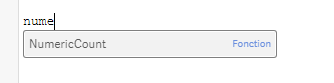
It does Sunny,; bur with qlik sense it appears as if it does not..sense does not even recognize it ! and that's why he thought it won't work :
see :

Sense won't even complete it :
sunny_talwar
- Mark as New
- Bookmark
- Subscribe
- Mute
- Subscribe to RSS Feed
- Permalink
- Report Inappropriate Content
I have seen that problem, but what I don't understand is how does NUMERICCOUNT works
